1953 William Olsson Economic Infographic Wall Map of Europe
EuropaEkonomisk-williamolsson-1953$2,500.00


Title
Ekonomisk Karta Över Europa.
1953 (dated) 52 x 67.76 in (132.08 x 172.1104 cm) 1 : 3250000
1953 (dated) 52 x 67.76 in (132.08 x 172.1104 cm) 1 : 3250000
Description
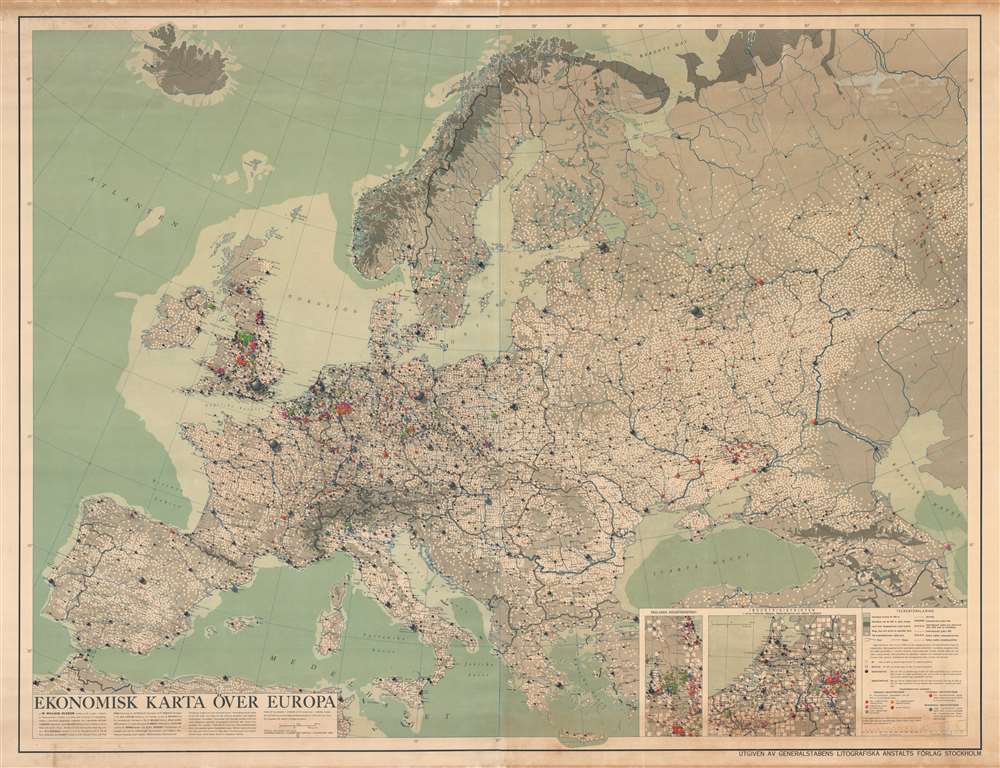
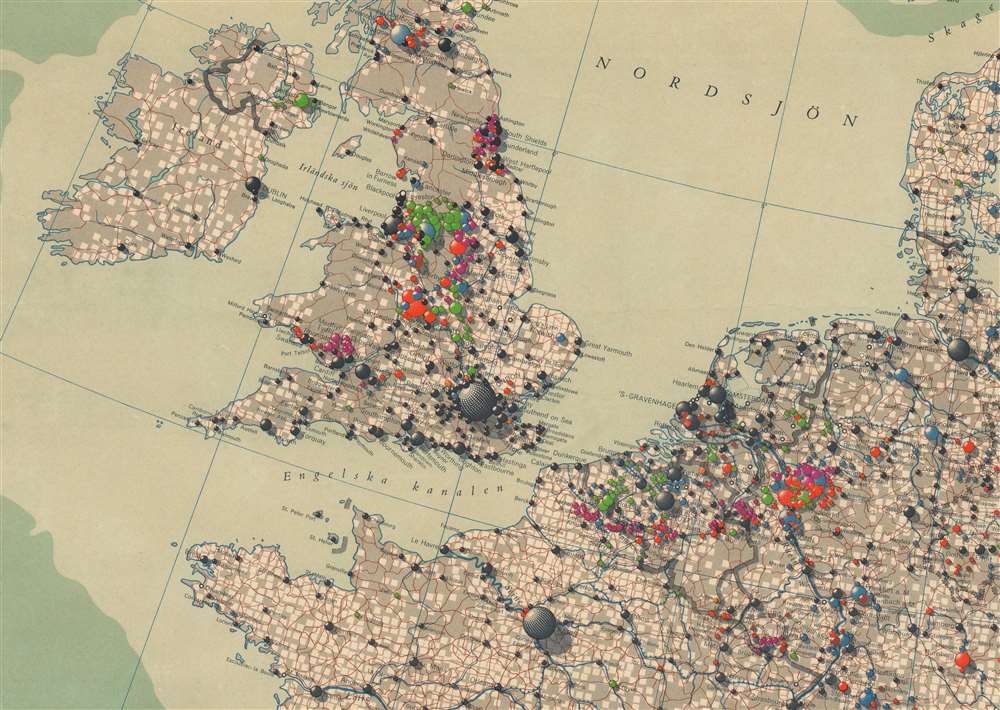
A striking and fascinating 1953 infographic wall map of Europe drawn by the Swedish economic geographer William Frits William-Olsson. Working in the wake of World War II (1939 - 1945), William-Olsson was striving to develop a new symbolic vocabulary for assessing economic growth and development patterns. This expansive pedogeological map covers the entire continent of Europe. Insets in the lower right focus on the dense and highly industrialized Netherlands and English midlands. The map is necessarily large to cover its immense detail and complex iconography. The whole is covered with a complex array of symbols, intended to present a full picture of the European economic situation, as well as illustrate how urban centers inter-related and evolve.
Understanding the Map
The map attempts to illustrate the economic structure of Europe based upon population and local industries. Much of the map is dominated by small white squares, each representing one square mile of cultivated land. Cities and towns with more than 10,000 people are represented by color coded oval spheres. The larger the population, the larger the sphere - keyed to a graded table the lower right. Spheres are further color coded to represent industry type and production,- Red - Metalwork and Ore Mining.
- Purple - Coal Mining and Oil Production.
- Green - Textile, Clothing, and Footwear Production.
- Orange - Pulp and Paper Industries.
- Ochre - Other Industries.
- Grey - Service Industries.
Criticism
The map is effective in highlighting industrial and agricultural zones, as well as illustrating how they feed larger population centers like London, Paris, and Berlin. Nonetheless, it was criticized by William-Olsson's contemporaries, as well as by the author himself, for being too vague, offering an imbalanced perspective with regard to Scandinavian agricultural production vs. Mediterranean production, and not accounting sufficiently for forests and mountains and how they impact agriculture.Publication History and Census
This map was drawn by William Frits William-Olsson and published in Stockholm by Generalstabens Litografiska in 1953. We note that most references to the map refer a pamphlet and atlas of the same name outlining William-Olsson's economic theories. The OCLC cites about 12 examples in collections, but upon closer inspection, most refer to the pamphlet or atlas, or are only partial maps. Rare to the market.Cartographer
William Frits William-Olsson (November 27, 1902 - February 21, 1990) was a Swedish geographer and economist. William-Olsson was born in Stockholm and graduated from Lundsberg in 1921, then in 1927 receiving a degree in philosophy from Uppsala in 1927. He received a doctorate in philosophy in 1937 and went on to become an associate professor of Geography at the Stockholm School of Economics. He became a full professor in 1946 and taught Economic Geography through 1969. More by this mapmaker...
Condition
Very good. Some toning at upper and and lower edges of map, as well as margins. Laid on original linen.
References
OCLC 477047923.