This item has been sold, but you can get on the Waitlist to be notified if another example becomes available, or purchase a digital scan.
1935 Mayor's Committee on City Planning Map of New York City: Residential Age
NewYorkAge-deutsch-1935$1,250.00

Title
Mayor's Committee on City Planning The City of New York: Predominant Residential Age.
1935 (dated) 37 x 37 in (93.98 x 93.98 cm) 1 : 48000
1935 (dated) 37 x 37 in (93.98 x 93.98 cm) 1 : 48000
Description
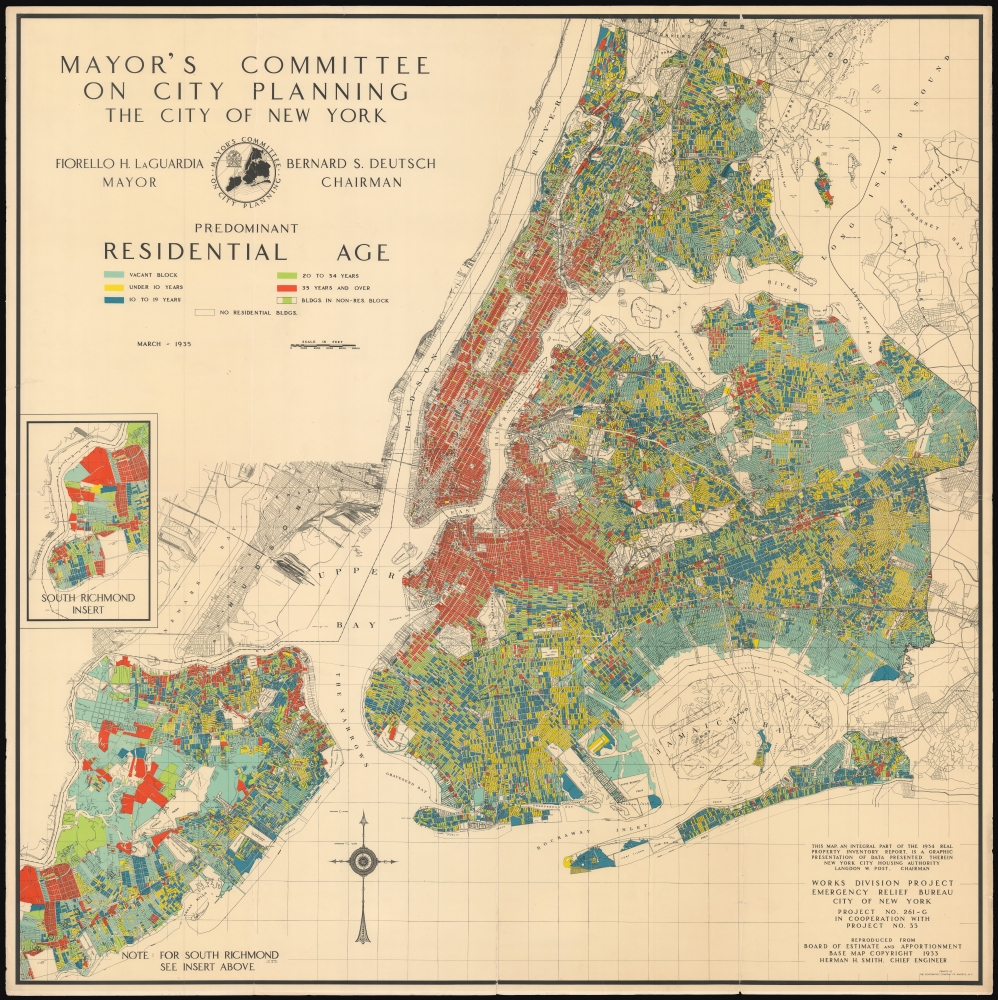
This rare, large, vivid, and superbly detailed 1935 infographic map of New York City - fruit of the labors of New York City's Emergency Relief Bureau, and the Mayor's Committee on City Planning - presents in granular detail the predominant ages of New York City's residential population. No. 1 - Population No. 2 - Day Population No. 3 - Predominant Use No. 4 - Predominant rental per family quarter No. 5 - Predominant Residential Age No. 6 - Predominant Residential Type No. 7 - Predominant Non-Residential Type No. 8 - Existing Streets The present example is the fifth sheet, focusing on predominant residential age.
The framework for each of these maps is the same: Herman H. Smith's 1933 map, produced on behalf of the New York City Board of Estimate and Apportionment: a New York City governmental body responsible for many areas of municipal policy and decisions, including the budget and land-use. Mayor La Guardia and Board of Aldermen president Deusch (both named on the map) were in leadership positions of the Board of Estimate and Apportionment, as well as the Committee on City Planning.
Pale blue areas - indicating vacant blocks - illustrate broad zones that despite being on 'the grid' were still not yet developed. A significant portion of Staten Island - such as the wetlands of the western shore of the island - are here empty. Likewise, vast swaths of the Borough of Queens are presented as vacant. In particular, the southern crescent facing Jamaica Bay comprising present day East New York and JFK Airport are largely empty. Howard Beach and Canarsie stand out from these areas as settled towns, as does the Broad Channel neighborhood, linked by causeway to Rockaway Beach. The unusually large and broad blocks of blue, green and red in Staten Island are a statistical artifact of the very small populations surveyed there: we are skeptical that the wetlands around Fresh Kills, for example, were teeming with twentysomethings.
A Closer Look
The five boroughs are represented in bold color, block-by-block: an inset allows the inclusion of the southwestern extreme of Staten Island (Richmond, on the map). It was one of eight maps produced to visually synthesize the data recorded in the Housing Authority's 1934 'Real Property Inventory Report,' each of which focused on the presentation of a specific aspect of that data:li>The framework for each of these maps is the same: Herman H. Smith's 1933 map, produced on behalf of the New York City Board of Estimate and Apportionment: a New York City governmental body responsible for many areas of municipal policy and decisions, including the budget and land-use. Mayor La Guardia and Board of Aldermen president Deusch (both named on the map) were in leadership positions of the Board of Estimate and Apportionment, as well as the Committee on City Planning.
Where Were The New Yorkers?
Dark blue (predominant age of 10 to 19 years) and yellow areas - indicating a predominant age of under 10 years - show that all four outer boroughs were filled with young, large families. Manhattan north of 160th Street resembles the other boroughs in this respect, barring islands of youth scattered throughout. The block of yellow in the present-day 'Two Bridges' neighborhood, bounded by Catherine, Market, Monroe, and Cherry Streets was Knickerbocker Village, just completed in 1934: the affordable housing there was evidently a successful magnet of young families. Green areas, classified for predominant ages 20-34, are also mainly spread amongst the above family-focused areas of the outer boroughs. The Upper West Side of Manhattan, Harlem, and the neighborhoods facing the east side of Central Park must have been riotous with young men and women, based on this map! Red areas, populated by people 35 and older, dominate Manhattan and downtown Brooklyn - older neighborhoods in every respect.Pale blue areas - indicating vacant blocks - illustrate broad zones that despite being on 'the grid' were still not yet developed. A significant portion of Staten Island - such as the wetlands of the western shore of the island - are here empty. Likewise, vast swaths of the Borough of Queens are presented as vacant. In particular, the southern crescent facing Jamaica Bay comprising present day East New York and JFK Airport are largely empty. Howard Beach and Canarsie stand out from these areas as settled towns, as does the Broad Channel neighborhood, linked by causeway to Rockaway Beach. The unusually large and broad blocks of blue, green and red in Staten Island are a statistical artifact of the very small populations surveyed there: we are skeptical that the wetlands around Fresh Kills, for example, were teeming with twentysomethings.
City Maps, Source Maps
The maps of this series were primarily intended for municipal use, but there were a number of maps produced for general consumption throughout the decade that had their genesis in the Committee on City Planning maps. Most notable among these was Richard Edes Harrison's map of New York City - published in Fortune Magazine, in anticipation of the 1939 New York World’s Fair. Harrison's map was slightly reduced in size and reoriented to fit the whole of the city on one sheet without recourse to an inset map. Harrison's triumph was to synthesize the data from the population and primary use maps into a single cohesive work. The data from this 'Predominant Age' and the specific residential and non-residential type maps did not get pulled into Harrison's work, and so the present map represents an unusual glimpse at the visualized form of this data.Publication History and Census
This map was printed in 1935 by The Polygraphic Company of America, Inc. for city use. We do not see any of these Mayor's Committee on City Planning maps on the market with any frequency. They are rare in institutional collections, with examples listed by The University of Chicago, Princeton University, the University of Pennsylvania, Brigham Young University, and the University of Wisconsin, Milwaukee.CartographerS
Bernard S. Deutsch (September 25, 1884 - November 21, 1935) was an American lawyer, politician and Jewish leader. He was born in Baltimore in 1884, but attended CCNY and New York Law School. He began practicing law in 1905, rising to president of the Bronx County Bar Association, member of the Admissions Committee of the New York Bar Association, and member of the New York State Municipal Law Commission. He entered politics in 1932 when the City Bar Association declined to approve either the Democratic or Republican nominees for Supreme Court Justice. Mr. Deutsch gained 300,000 votes as an independent - this led to his nomination as Aldermanic President on the Fusion ticket in 1933. The City Fusion Party was the coalition by which Fiorello La Guardia had won the mayorship, and so Deutch's election by the party would bring him into close association with La Guardia. At the time of his death, he was President of the New York City Board of Aldermen, and was Chairman of the Board of Estimate and Apportionment, and had been president of The American Jewish Congress for seven years, during which he established that organization as an aggressive defender of Jewish rights in the face of widespread antisemitism in the wake of Hitler's rise to power in Germany. Via his Chairmanship of the Board of Estimate and Apportionment, he was put in charge of aspects of municipal policy, budget, and land-use, resulting in the production of an extensive array of maps between 1933 and 1935. More by this mapmaker...
Herman H. Smith (March 2, 1876 - March 3, 1957) was an American engineer. Nothing is known of his early education. He graduated from MIT in 1899, however, and began his career as a construction engineer with the Long Island Railroad. In 1903 he became a surveyor for the Brooklyn Bureau of Highways, later appointed Chief Engineer of Highways. He became Acting Chief Engineer of the New York City Board of Estimate and Apportionment in 1921, and became Chief Engineer in 1928, a post he retained until his retirement in 1934. As Chief Engineer, he was responsible for preparing city maps used to determine zoning and street layout. He also produced master maps for assigning housing projects, parkways, highways, bridges and tunnels. The mapping of Staten Island was a personal focus: he was also a vocal proponent for the development of the Brooklyn-Battery Tunnel (funding issues would prevent work on the tunnel from beginning until 1940.) Learn More...
The Polygraphic Company of America, Inc. (fl. 1924 - 1976) was a commercial printer, established in New York City in 1924. They were noted as pioneers in the use of cut film in the printing process. Eventually, the firm sold the film part of the business to focus on offset lithography. In 1936 the company relocated to Bennington, VT. In 1968 the name was changed to Garrison Printing Division, Inc. The company declared bankruptcy in 1971 and in May 1972 became Economy Graphics, finally closing in 1976. Learn More...
Condition
Very good. Reinforced areas of wear to some folds and margins with virtually no loss, else excellent.
References
OCLC 76832976.