This item has been sold, but you can get on the Waitlist to be notified if another example becomes available, or purchase a digital scan.
1968 Civic Education Service Broadside Map of 1968 U.S. Presidential Election
1968Election-civiceducation-1968$175.00

Title
Headline Focus Wall Map 1. U.S. Political Scene - - Spotlight on '68 Elections.
1968 (dated) 36.25 x 27 in (92.075 x 68.58 cm)
1968 (dated) 36.25 x 27 in (92.075 x 68.58 cm)
Description
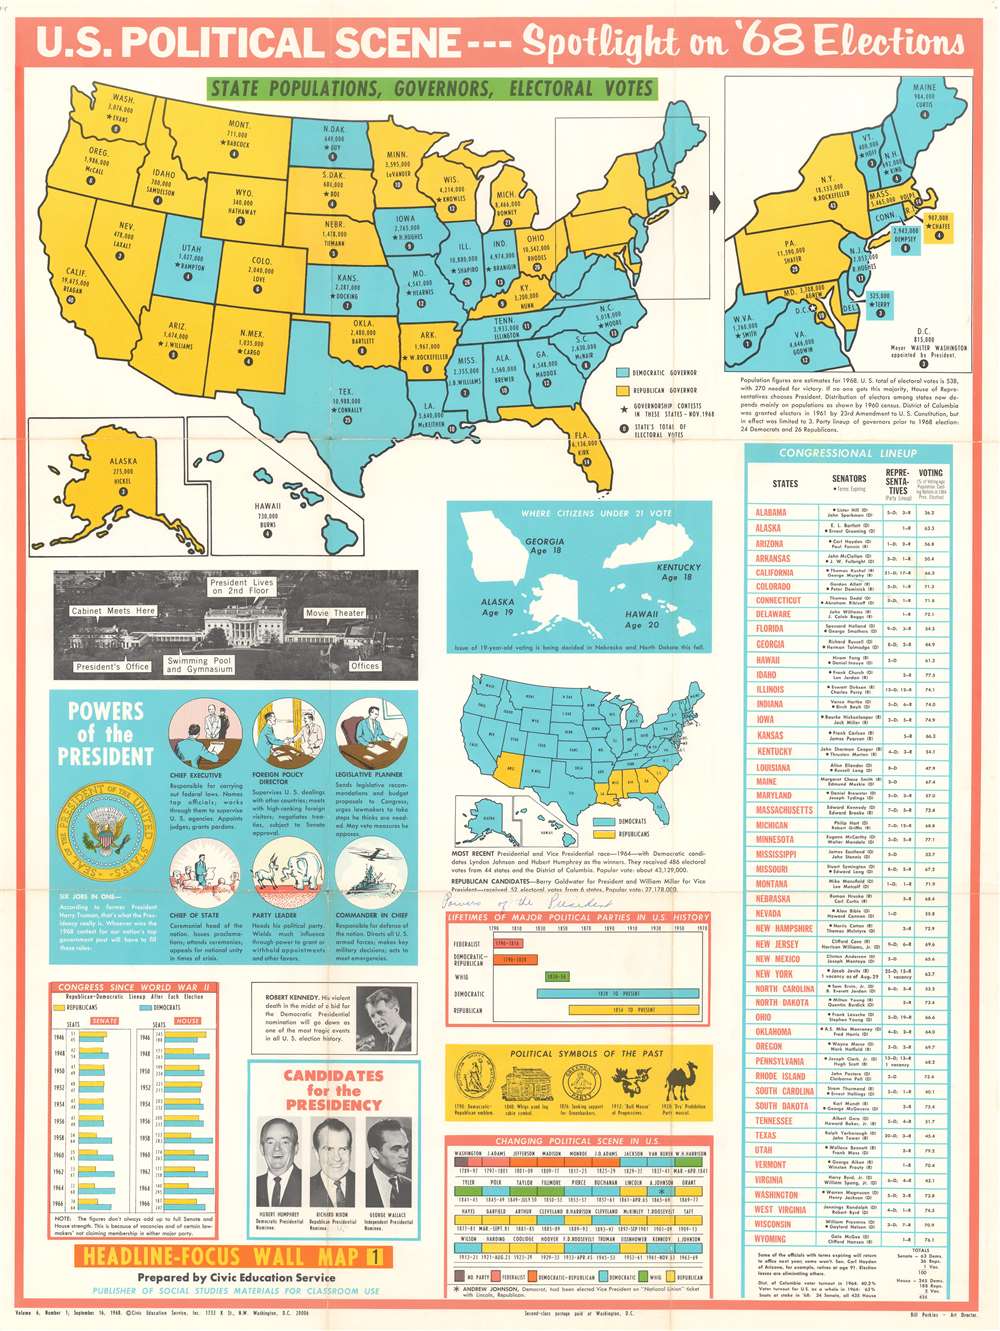
This is a 1968 Civic Education Service broadside of the 1968 U.S. presidential election. The broadside combines an electoral map of the United States with information about the Presidency, American political history, voting trends, and photographs of the then-current candidates for the Presidency: Hubert Humphrey, Richard Nixon, and George Wallace. A political map of the United States occupies the top third of the broadside and provides viewers with information concerning each state's population, the governor's name, and the number of electoral votes allocated to each state. An inset to the right of the map of the continental U.S. focuses on the northeast, illustrating the region from Maine to Virginia. Two other insets, below and to the left of the large map, includes Alaska and Hawaii.
To the left of the table in the center column, an infographic notes that citizens under twenty-one years old could vote in Georgia, Alaska, Kentucky, and Hawaii, while nineteen-year-old voting was on the ballot in Nebraska and North Dakota during the 1968 election. It would not be until July 1971 that a national eighteen-year-old voting age would be adopted with the ratification of the 26th Amendment to the United States Constitution. Next appears a map of the 1964 presidential election results, with states that voted for the Democratic candidate (Lyndon Johnson) shaded blue and states that voted for the Republican candidate (Barry Goldwater) shaded yellow. Then appears a graph illustrating the lifespans of major political parties in the United States from 1790 until 1968, a series of illustrations presenting the insignia of third parties, including Theodore Roosevelt's 'Bull Moose' party from the 1912 election. And finally, at the bottom of the center column, is a chart which names each President, from Washington to Lyndon Johnson, that gives their party affiliation and the years they were in office, creating a striking visual comparison of the success of each party compared with the others.
The column on the far left focuses on the Presidency, with a photograph of the White House, previously known as the Executive Mansion, with labels marking the uses of each part of the building. Below this photograph is an infographic detailing the six different jobs or roles occupied by a president during their term in office. Per the broadside, the President is the Chief Cxecutive, the foreign policy director, the legislative planner, the Chief of State, the party leader, and the Commander in Chief. Finally, in the lower left corner, pictures of the three current candidates for the Presidency, Hubert Humphrey, Richard Nixon, and George Wallace, are included, as is a tribute to Robert Kennedy, who was assassinated in Los Angeles, California, in June 1968 just after winning the California primary. On the far left is a table comparing election results in the Senate and House of Representatives by party in the post-World War II era.
The Data
Below that, the rest of the broadside presents information relating to the election. A table along the right side presents the states in alphabetical order, names their senators, and includes how their representatives are divided by party. The last cell in each line of data gives the percentage of voting age adults that voted in the 1964 presidential election. The highest turnout percentage appears to be in Utah with 79.2, while the lowest appears to be in Mississippi, with 33.7.To the left of the table in the center column, an infographic notes that citizens under twenty-one years old could vote in Georgia, Alaska, Kentucky, and Hawaii, while nineteen-year-old voting was on the ballot in Nebraska and North Dakota during the 1968 election. It would not be until July 1971 that a national eighteen-year-old voting age would be adopted with the ratification of the 26th Amendment to the United States Constitution. Next appears a map of the 1964 presidential election results, with states that voted for the Democratic candidate (Lyndon Johnson) shaded blue and states that voted for the Republican candidate (Barry Goldwater) shaded yellow. Then appears a graph illustrating the lifespans of major political parties in the United States from 1790 until 1968, a series of illustrations presenting the insignia of third parties, including Theodore Roosevelt's 'Bull Moose' party from the 1912 election. And finally, at the bottom of the center column, is a chart which names each President, from Washington to Lyndon Johnson, that gives their party affiliation and the years they were in office, creating a striking visual comparison of the success of each party compared with the others.
The column on the far left focuses on the Presidency, with a photograph of the White House, previously known as the Executive Mansion, with labels marking the uses of each part of the building. Below this photograph is an infographic detailing the six different jobs or roles occupied by a president during their term in office. Per the broadside, the President is the Chief Cxecutive, the foreign policy director, the legislative planner, the Chief of State, the party leader, and the Commander in Chief. Finally, in the lower left corner, pictures of the three current candidates for the Presidency, Hubert Humphrey, Richard Nixon, and George Wallace, are included, as is a tribute to Robert Kennedy, who was assassinated in Los Angeles, California, in June 1968 just after winning the California primary. On the far left is a table comparing election results in the Senate and House of Representatives by party in the post-World War II era.
Publication History and Census
This broadside was created by the Civic Education Service and published as Volume 6, Number 1 on September 16, 1968. Even though this broadside was created for use in classrooms and thus probably widely distributed, it is extremely rare today, as we have been unable to locate any examples in private collections and only a few instances when it has appeared on the private market.Cartographer
The Civic Education Service (fl. c. 1939 - 1945, 1963 - 1972) was a publishing firm based in Washington, D.C. that produced maps and other visual material for academic purposes. Our research has led us to believe that an organization known as the Civic Education Service existed from c. 1939 - c. 1945 (during World War II) and from c. 1963 - c. 1972. We have been unable to determine if this is the same organization that was closed for almost twenty years, or if the organization that published maps and other educational materials in the 1960s and 1970s was unrelated to the Civic Education Service that published books, maps, and other materials during World War II. More by this mapmaker...
Condition
Good. Wear and toning along original fold lines. Small areas of infill at two fold intersections. Verso repairs to fold separations. Exhibits pinholing at corners. Blank on verso.