1939 Romer Pictorial Resource Map of South America
BattlegroundCommerceSouthAmerica-romer-1939$450.00

Title
Battleground of Commerce.
1939 (dated) 22 x 15 in (55.88 x 38.1 cm) 1 : 15000000
1939 (dated) 22 x 15 in (55.88 x 38.1 cm) 1 : 15000000
Description
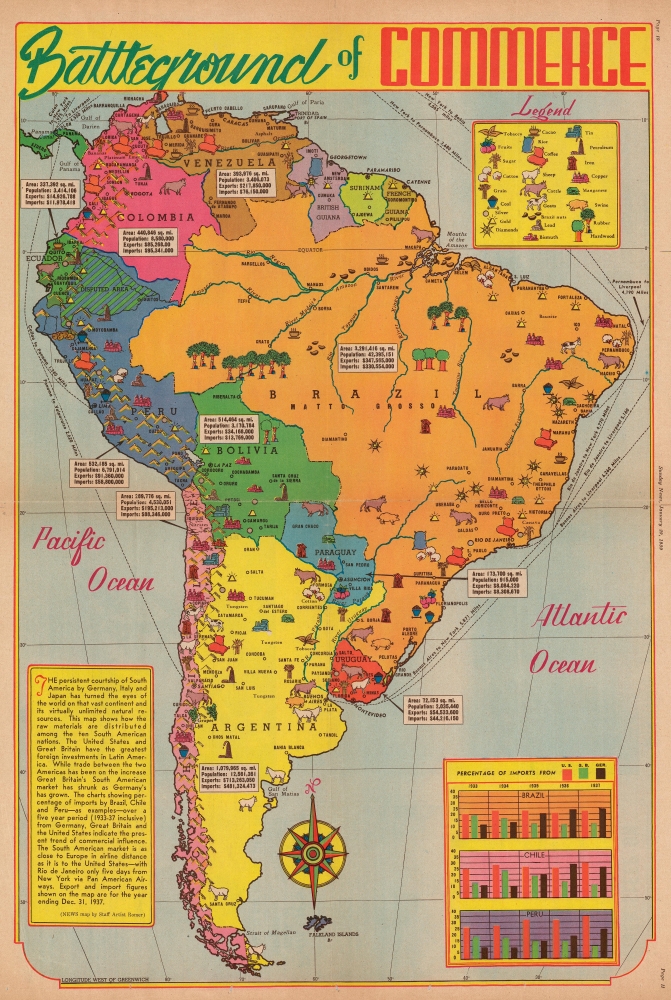
This is a 1939 Jack Romer pictorial resource map of South America, published eight months before the outbreak of World War II (1939 - 1945). The map highlights the decline in British trade and the corresponding rise in German trade through South America. Romar focuses on this growing trade imbalance and emphasizes the significance of South America's resources in the impending war - this was, after all, the world's primary source of rubber, an essential raw material in modern mechanized militaries.
Icons scattered from Colombia and Venezuela to Chile mark everything from tobacco, cotton, and coffee, to sheep, cattle, and goats, to petroleum, rubber, copper, and iron. Every country in South America has something of value. Shipping routes between South America, New York, and Liverpool are illustrated by dashed lines.
The text box in the lower left illustrates how trade between the Americas increased between 1933 and 1937, as did trade between Germany and South America. However, trade between South American countries and Great Britain decreased dramatically over the same period - suggesting that the Allies might be losing ground. These numbers are illustrated by a series of graphs in the lower right.
A Closer Look
Coverage embraces South America in full, from Panama to Tierra del Fuego and from the Pacific to the Atlantic. Romer and the Sunday News highlight the natural riches of South America and their implied strategic importance to Germany, Italy, and Japan.Icons scattered from Colombia and Venezuela to Chile mark everything from tobacco, cotton, and coffee, to sheep, cattle, and goats, to petroleum, rubber, copper, and iron. Every country in South America has something of value. Shipping routes between South America, New York, and Liverpool are illustrated by dashed lines.
The text box in the lower left illustrates how trade between the Americas increased between 1933 and 1937, as did trade between Germany and South America. However, trade between South American countries and Great Britain decreased dramatically over the same period - suggesting that the Allies might be losing ground. These numbers are illustrated by a series of graphs in the lower right.
Publication History and Census
This map was created by Jack Romer and published by the New York Sunday News on January 29, 1939. The only other known example is part of the David Rumsey Map Collection at Stanford University.Cartographer
Jack Romer (1898 - April 28, 1967) was a staff artist for the New York Daily News who produced maps and charts for publication in the newspaper. Romer began working for the New York Daily News around 1932 and worked there until his death. More by this mapmaker...
Condition
Very good. Newsprint. Closed margin tears professionally repaired on verso. Text and printed photographs on verso.
References
Rumsey 8511.000. OCLC 953572649.