This item has been sold, but you can get on the Waitlist to be notified if another example becomes available, or purchase a digital scan.
1931 Bruce-Roberts Pictorial Map of Chicago 'Gangland'
ChicagoGangland-bruceroberts-1931$11,500.00

Title
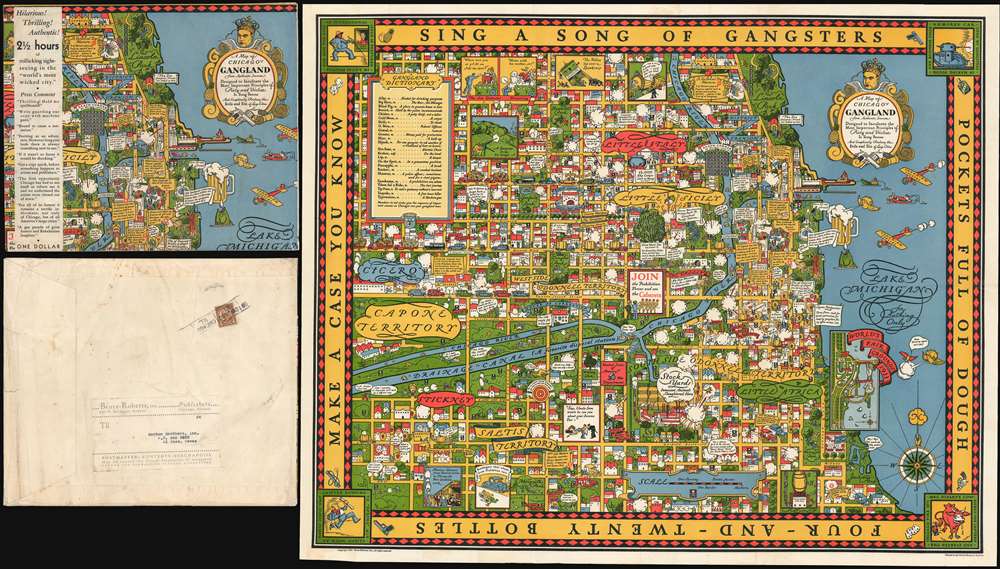
A Map of Chicago's Gangland from Authentic Sources. Designed to Inculcate the Most Important Principles of Piety and Virtue in Young Persons and Graphically Portray the Evils and Sin and Large Cities.
1931 (dated) 23 x 28 in (58.42 x 71.12 cm)
1931 (dated) 23 x 28 in (58.42 x 71.12 cm)
Description
Perhaps the greatest pictorial map of all time, this is the legendary 1931 Bruce-Roberts cartoon map of Gangland Chicago, accompanied by its original mailer. Although not drawn to scale, the map covers downtown Chicago from Lincoln Park to Jackson Park and west as far as Cicero and Stickney. When this map was issued, Chicago's Prohibition Era gang wars were winding down. Al Capone, Chicago's criminal king-pin, was convicted of tax evasion and sentenced to 11 years in federal prison in October of this same year. Nonetheless, as this went to press, probably in August or September of 1931, all of Chicago was reeling from years of violent gang warfare. Unlike any previous pictorial map, the revolutionary unknown artist that drew this map is embracing politically, socially, and legally complex issues at the moment of their highest volatility. It comes thus as no surprise that the artist chose to remain anonymous. Despite its violent if cartoonish content, the map was issued with the noble intent, 'to inculcate the most important principles of Piety and virtue in young persons and graphically portray the evils and sin of large cities.'
The mailer is addressed to Norton Brothers Inc. of El Paso Texas. Norton Brothers, which remains in business today, is one of El Paso's oldest bookstores and stationers. The firm was founded in 1903 by Charles F. Wilkcon, L. Blakesley, and J. G. Freeman, as the International Book and Stationery Co., Inc. In 1907, it was acquired by Fred W. Norton, who had just moved to El Paso from Sedalia, Missouri. When this map was issued and purchased, the firm remained under the leadership of Fred Norton. Is now managed by his descendants.
In the case of the these three maps, the designers and cartographers are known and well documented. Although clearly different designers, it is clear that all are deeply inspired tributes Gill's 1914 map.
This map is very rare. We are aware of only 3 examples in institutional collections: Library of Congress, Newberry Library, University of Illinois Library. Two are known in private hands, one of which is the variant 4-color state.
The Noble Experiment and its Not-So-Noble Results
In 1931, when this map was issued, the Noble Experiment of Prohibition was still in effect. Prohibition, which lasted from January 17, 1920 to December 5, 1933, was a nationwide Constitutional ban on the manufacture, importation, transportation, and sale of all alcoholic beverages. The ban on alcohol led to a major shift in American social life. Thousands were immediately put out of work when the breweries, bars, and distilleries closed, transforming American urban life. While legal bars closed, illegal bars, called speakeasies or gin-joints, as well as home distilleries and breweries, and more, flourished. The existing criminal element took control of much of this enterprise, leading to the development of organized crime as we know it today.Chicago during Prohibition
While most large American cities saw a rise in organized crime and the opening of countless speakeasies, Chicago was perhaps the most famous 'gangland' city. With its close proximity to Canada (where spirits remained legal) via the Great Lakes, and central location as a railroad hub and port, low-paid corrupt police force, and large wealthy population, Chicago was ideally suited to act as a nexus for the illegal import, manufacture, and distribution of alcohol. Powerful crime lords rose to dominate Chicago, where they became popular cultural figures, with robin-hood-like notoriety, who were welcome in high society, business, and political circles.Gang Territories
Various syndicates, read 'gangs', vied for control of the city, dividing Chicago into unofficial 'territories' controlled by one group or another - hence Chicago became known as 'Gangland.' Rival gangs waged constant war on one another, much of which this map attempts to chronical. The stomping ground of the notorious crime boss Al Capone, leader of the Chicago Outfit, is noted in large lettering along with the territories of South Side O’Donnell, the Saltis, and others. (Capone is also featured in the cartouche, where he is granted a crown and a cherub-like aspect). Events in Chicago’s Gangland Wars are carefully traced, with annotations and describing the order of events, among them, the Saint Valentine’s Day Massacre, and the murders of Capone rivals Joseph Aiello and 'Big Jim' Colosimo. Various mob hits are identified with skull and crossbones icons - note 'Dead Man's Tree' at 725 Loomir Street, and 'Death Corner' at the intersection of Milton and Oak.The Unknown Artist Speaks
The only knowledge we have been able to unearth regarding the map's designer is an interview in the August 6, 1931 issue of the Madison Capital Times,A suburban artist well known in Chicago art circles designed the map. He is not identifying himself with the project, however. 'It is not art,' he said. 'People who buy my pictures wouldn't appreciate the fact that I did such trivial things as maps. But you know - I've had a lot of fun doing this thing. And I learned things? I've read volumes on Chicago's crime and crime characters, gone places and seen things. I've done everything I possibly could to make the thing absolutely authentic.While this narrows the field a little, we still cannot definitively pinpoint the artist. One possibility is Charles Turzak (1899 - 1985), a Chicago area artist and print maker active during this period who did in fact produce one acknowledged map, Chicago U.S.A, also in 1931, which although more 'kosher' (see gangland dictionary on this map), features similar printing, design, typography, and even humor.
Censured by Chicago
Although masterfully executed and a wonder of pictorial imagery, this map was unpopular with Chicago's civic administration, at the time working hard to spruce up Chicago's image in anticipation of 1933 Chicago Century of Progress World's Fair. Under mayor Aton J. Cermak, inaugurated in April of 1931, the city put forth a concerted effort was to acquire and destroy all examples of the map out of concern that it gave Chicago a 'bad image,' hence the map's extreme scarcity today. Other targets of Cermak's censure include the popular gang movie, 'On the Spot.'The Mailer
This map is rare, but its mailer/envelope, included here, is even more so, in fact, we believe it to be one of only two surviving examples, the other is held at the Newberry Library. The front of the mailer features an outtake from the map, as well as promotional material describing it as 'Hilarious! Thrilling! Authentic! 2 1/2 hours of rollicking sight-seeing in the 'world's most wicked city.' The map was apparently well received by the press, and their quotes and praises reveal much of the significance this map had for Chicagoans,Thrilling! Held me spellbound.The present mailer dates to the original publication of the map, and includes postage (4 cents) and the Bruce-Roberts mailing label.
Bound to cause a sensation.
Get a copy quick, before something happens to artists and publishers.
The First opportunity Chicago has had to see itself as others see it and we understand the artists were chased out of town.
For all of its humor it remains a terrific indictment, not only of Chicago, but of all America's large cities.
A Gay parade of grim humor and Rabelaisian laughter.
The mailer is addressed to Norton Brothers Inc. of El Paso Texas. Norton Brothers, which remains in business today, is one of El Paso's oldest bookstores and stationers. The firm was founded in 1903 by Charles F. Wilkcon, L. Blakesley, and J. G. Freeman, as the International Book and Stationery Co., Inc. In 1907, it was acquired by Fred W. Norton, who had just moved to El Paso from Sedalia, Missouri. When this map was issued and purchased, the firm remained under the leadership of Fred Norton. Is now managed by his descendants.
In Context with Other Maps of the Period
No artist has been identified for the Gangland map, but we have noticed a striking similarity to several other maps of the period, most notably- 1914 - Wonderground Map of London Town, Macdonald Gill.
- 1927 - A Map of Honolulu and the Sandwich Islands, which we now call the Hawaiian Islands, Alexander Samuel MacLeod.
- 1932 - The Sydney Harbour Bridge Map commemorate the opening, 19th day of March, Lord, 1932, by Russell Lloyd and Victoria Cowdroy
In the case of the these three maps, the designers and cartographers are known and well documented. Although clearly different designers, it is clear that all are deeply inspired tributes Gill's 1914 map.
Chromolithography
This map was printed using a combination of color lithography (Chromolithography) and offset printing - the borders are partially offset printing. Chromolithography is a color lithographic technique developed in the mid-19th century. The process involved using multiple lithographic stones, one for each color, to yield a rich composite effect. Oftentimes, the process would start with a black basecoat upon which subsequent colors were layered. Some chromolithographs used 30 or more separate lithographic stones to achieve the desired effect. Chromolithograph color could also be effectively blended for even more dramatic effects. The process became extremely popular in the late 19th and early 20th centuries, when it emerged as the dominate method of color printing. The vivid color chromolithography produced made it exceptionally effective for advertising and propaganda imagery.20th Century Pictorial Cartography
Pictorial qualities have been common in cartography from at least from the 16th century, when publishers like Braun and Hogenberg incorporated view-like qualities and other pictorial elements into their famous city plans. Braun and Hogenberg, and similar cartographers, issued their town books to express, not necessarily the geography their subjects, but rather the 'essence' of the town/city. As mathematics and surveying principles became more advanced, travel increased, and the ability to translate 2 dimensional cartographic perspectives into an understanding of the actual world became commonplace, maps themselves transformed. This trend is a recognizable progression that evolved cartographic conventions from the 17th to the 19th centuries. By the late 19th century most maps had become geographical tools that illustrated the region cartographically, but failed in the original raison d'être as expressed by Braun and Hogenberg, to illustrate a place's 'essence.' So, where a city map of 19th century Paris might provide a completely navigable presentation of the city, one could glean almost nothing of Paris' character from said map. It was in the late 18th century that the first modern 'pictorial' style maps developed. These maps, like Tomas Lopez's 1788 map of Seville attempted to provide both cartographic accuracy and pictorial elements that might convey the character of the city. In that case, Lopez incorporated pictorial vignettes to illustrate important buildings and monuments. This style became increasingly commonly throughout the 19th century and early 20th centuries, particularly for centers of commerce like London, Paris, and Rome, where they are often mass produced and referred to as 'monumental' maps. The style further evolved in the early to mid-20th century, when revolutionary cartographers and illustrators like MacDonald Gill, Jo Mora, Frank Dorn, Ernest Dudley Chase, and many others, combined vignette style illustrations, modern printing techniques, inspiration from Japanese printmaking and manga, and from clever satirical cartographers/artists like Fred Rose, to produce maps that once again focused on revealing the essence a place, usually, but not always, at the sacrifice of cartographic precision.Publication History and Census
There are at least two variant states of this map. One, as here, printed in 5 color chromolithograph. And a second variant, in 4 colors, lacking green. A promotion for the original publication in the Capital Times, Madison, suggests that the 5-color variant is the first. A reproduction was issued in 1982 by 'Prohibition Map of Chicago.'This map is very rare. We are aware of only 3 examples in institutional collections: Library of Congress, Newberry Library, University of Illinois Library. Two are known in private hands, one of which is the variant 4-color state.
Cartographer
Bruce-Roberts, Inc. (fl. 1928 - August 1931) was a Chicago publishing firm based at 540 North Michigan Avenue. They are most famous for publishing the famous pictorial map Chicago Gangland. Advertisements for Bruce-Roberts Inc. appear in Chicago publications from 1828 through April of 1931, although they were still active in August. Following this date, there is no further evidence of the firm. On the envelope that was originally published with the Chicago Gangland map, there is some hint that they were driven out of town by city politicians (and maybe gangsters) reacting to the map. Other known work includes a book on Golf, another on the virtues of marriage, and an instructional manual on 'Winning Backgammon.' The name of the firm suggest that 'Bruce' and 'Roberts' are different people. The 1830 census identifies only 1 'Roberts' working as a publisher, George F. Roberts (1859 - 19??), who was 71 in 1930, but apparently still active. As for Bruce, this may be the Canadian born William M. Bruce (1882 - 19??), who is listed as a 'Book Publisher' in the same census. More by this mapmaker...
Condition
Very good. Accompanies original binder. Some vestiges of old framing on verso. Slight wear on original fold lines.
References
University of Illinois, Map +G 10896.548. Library of Congress, G4104.C6E625 1931 .M3. Newberry Library, map G 10896 .548. Brown, Kevin and Hunt, Spencer, Great City Plans, pages 198 - 199.