1883 Scribner's Map of the United States Illustrating American Industry
Manufactures-scribners-1883$225.00

Title
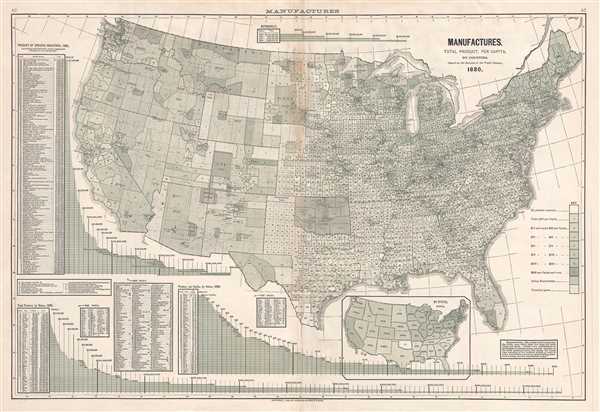
Manufactures. Total Product, Per Capital, By Counties. 1880.
1883 (dated) 17.25 x 25 in (43.815 x 63.5 cm) 1 : 8557000
1883 (dated) 17.25 x 25 in (43.815 x 63.5 cm) 1 : 8557000
Description
This is a Fletcher W. Hewes and Charles Scribner's Sons map of the United States illustrating the distribution of American manufacturing, which is not limited to products created in factories in the statistics provided. Depicting the continental United States from the Pacific Ocean to the Atlantic Ocean and from the Canadian border to the border with Mexico, the map provides an incredible 'bird's eye view' of how American industry was dispersed across the country per the census of 1880. The central map is divided into counties, and each county is shaded with a different pattern and shade of green. Each pattern and shade corresponds with the per capita value of products created in each county, from under $15 per capita to over $200. A key along the right border explains the breakdown of each color and pattern combination. Other notations are used to denote counties that reported that no products were manufactured there, Indian Reservations, and 'unsettled parts'.
Below the central map, a smaller inset map of the United States displays the overall amount of per capita manufacturing per state. Each state is shaded in the same way that the counties are shaded on the larger, central map. The states are also numbered, making it more apparent as to how each state compares with the others. A graph to the left of the inset map ranks the forty-seven states of the United States in order of their per capita production of their most valuable products. A larger, more detailed graph along the left border compares the total value of products manufactured in given industries (beginning with industries that produce in aggregate over $5,000,000 of product per year). The graph along the bottom border compares the total value of manufacturing in each state, with Arizona as the least and New York at the top, as the only state to produce of $1 billion worth of goods.
This map was produced by Fletcher W. Hewes and included in the Citizen's Atlas of American Politics 1789-1892. It was copyrighted by Charles Scribner's Sons in 1883.
Source
Hewes, F. W., Citizen's Atlas of American Politics. 1789-1892., (New York: Charles Scribner's Sons) 1892.
Condition
Very good. Light wear and soiling along original centerfold. Blank on verso.