This item has been sold, but you can get on the Waitlist to be notified if another example becomes available, or purchase a digital scan.
1883 Scribner's Voting Map of the United States
PopularVote1880-hewes-1883$112.50

Title
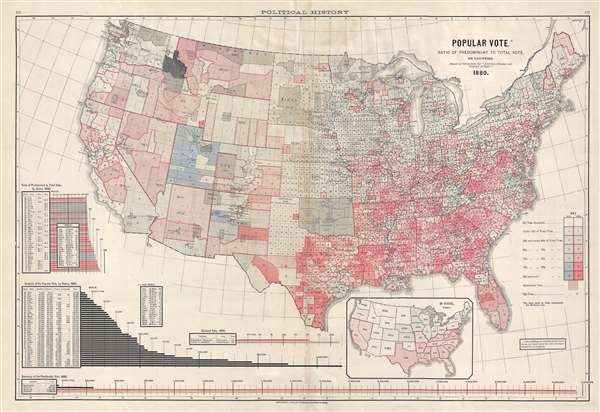
Popular Vote. Ratio of Predominant to Total Vote, by Counties.
1883 (dated) 17 x 24.5 in (43.18 x 62.23 cm) 1 : 8557000
1883 (dated) 17 x 24.5 in (43.18 x 62.23 cm) 1 : 8557000
Description
This is a Fletcher W. Hewes and Charles Scribner's Sons political map of the United States. The map depicts the continental United States from the Pacific Ocean to the Atlantic Ocean and from the Canadian border to the border with Mexico. Illustrating the results of the election of 1880 between James A. Garfield and Winfield S. Hancock by county, each state is divided into counties, which are numbered. The counties are then colored with different shades of red (for Democratic majorities) and blue (for Republican majorities). The darker the shade of red or blue, the greater the majority. The lightest shades represent majorities totaling less than 55% of the total vote, whereas the darkest shades represent majorities totaling over 90% of the total vote. The divide between Republicans and Democrats is clearly entrenched, with a deeply Democratic South and a majority of northern states voting Republican. It is important to note here that the Democratic and Republican Parties did not hold the same viewpoints and philosophies that they do today. These two parties have changed over time. A key explaining the shading on the map is situated along the right border, with a note stating that the blue color in Utah represents the Mormon vote.
Below the central map, a smaller inset map of the United States displays the electoral college vote by state. The numbers located in each of the states do not correlate to the number of electoral votes each state cast, they represent the percent of the total vote won by which candidate. The higher numbers correlate to a greater majority. The white states are actually territories, which did not have votes in the electoral college to elect the president. Tables, located in the lower left corner of the map, further break down the election results, analyzing the popular vote and the ratio of the predominant to total vote by state, among other statistics.
This map was produced by Fletcher W. Hewes for inclusion in the Citizen's Atlas of American Politics 1789-1892 and copyrighted by Charles Scribner's Sons in 1893.
Source
Hewes, F. W., Citizen's Atlas of American Politics. 1789-1892., (New York: Charles Scribner's Sons) 1892.
Condition
Very good. Wear along margins. Light soiling along top margin. Verso repair of centerfold separation. Blank on verso.