
Townsend, Charles Haskins (sold)
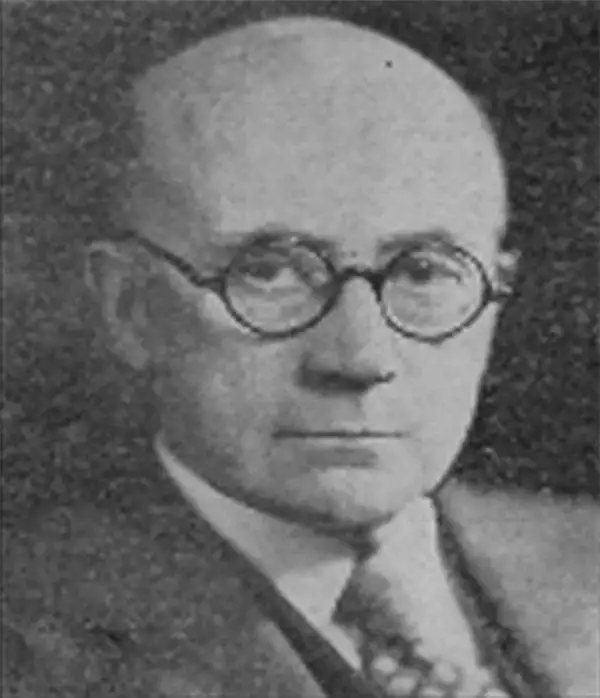
Charles Haskins Townsend (September 29, 1859 – January 28, 1944) was an American zoologist. He served as assistant United States Fish Commissioner, was in charge of deep-sea explorations on the USS Albatross, and at the turn of the century served as chief of the Fish Commission's fisheries division. From 1902 go 1937 he was director of the New York Aquarium at Castle Garden. During his career he testified as an expert at The Hague, served as president of the American Fisheries Society, and was elected a fellow of the New York Academy of Sciences. He wrote extensively on fisheries, whaling, fur seals, deep-sea exploration and zoology, including ornithology and herpetology.
Rare World Map Chronicling Over a Century's Hunting of Right Whales
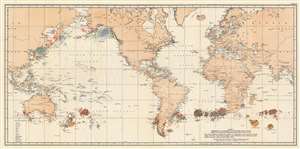
Chart C: Distribution of Northern and Southern Right Whales Based on Logbook Records Dating from 1785 to 1913.
sold
- Digital Map Information
- Suitable for large format printing
- File Size: 33.59 MB
- File Type: ZIP / TIFF
- ICC color profile embedded
- Delivered instantly via download link
A rare 1935 world map on the Mercator projection, and a masterpiece of the visual display of qualitative information. This zoological world map presents over a century’s worth of data, showing the global distribution of northern and southern right whales based on whaling captains’ logbooks. These being drawn from an array of American institutional and private collections, the data reveals both the migratory patterns of these whales, and in particular the whaling grounds frequented by American ships encompassing the 19th century. Zoologist Charles Townsend and a team of scholars compiled data of logged sightings of sperm, bowhead, humpback and right whales. The observations date from as early as 1761 and as late as 1920, and represent the records of more than 1600 individual voyages. The data was then committed to four maps, of which this is the third.
The map marks the positions of 8415 sightings of right whales with a dot. The color of each dot corresponds to the month of the sighting. By observing this correlation of location with the time of year, Townsend’s object was to make apparent the seasonal movements of the whales, and in this he was clearly successful: the reader can easily distinguish the migration of whales from northern, summer feeding grounds to the warmer southern grounds during the winter. Since Townsend's data comes from whaler's records, specifically American ones, one might argue that the sample of whale sightings is skewed to reflect not so much the whales' migratory patterns as the American whalers' hunting patterns; nevertheless, that taken into consideration the visual presentation of this data here is remarkable. (more details)
The map marks the positions of 8415 sightings of right whales with a dot. The color of each dot corresponds to the month of the sighting. By observing this correlation of location with the time of year, Townsend’s object was to make apparent the seasonal movements of the whales, and in this he was clearly successful: the reader can easily distinguish the migration of whales from northern, summer feeding grounds to the warmer southern grounds during the winter. Since Townsend's data comes from whaler's records, specifically American ones, one might argue that the sample of whale sightings is skewed to reflect not so much the whales' migratory patterns as the American whalers' hunting patterns; nevertheless, that taken into consideration the visual presentation of this data here is remarkable. (more details)