
1897 Hickmann Infographic Map of German and Austrian Beer and Wine Production

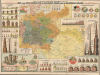
Prof. A. L. Hickmann’s geogr.-statist. Darstellungen über die Bier- und Wein-Produktion im Deutschen Reiche und in Österreich-Ungarn.
Triumph of data visualization.
- Digital Map Information
- Suitable for large format printing
- Full resolution TIFF file
- ICC color profile embedded
- Delivered instantly via download link
Triumph of data visualization.
This is Anton Leo Hickmann's c. 1897 colorful chromolithograph statistical map of beer and wine production in the German Empire and Austria-Hungary, published by G. Freytag and Berndt in Vienna. A noted master of the infographic, Hickmann turns the objects of drinking and brewing into instruments of comparison: casks measure trade, towers of barrels rank national output, and elaborate steins compare consumption. The central map provides a complementary geography of drinking, locating breweries and coloring regions according to annual per-capita beer consumption. Published during the industrial expansion of brewing and the phylloxera crisis in European vineyards, the sheet brings two industries undergoing markedly different transformations into a single comparative display.A Closer Look
The central map covers the German Empire and Austria-Hungary, extending from the North Sea and Baltic to the Adriatic and the southern Habsburg territories. Its principal color scheme represents annual per-person beer consumption, with nine classes ranging from under 10 liters to over 200 liters. Large blue circled figures reinforce the regional comparisons. These distinguish the heavily beer-drinking regions of southern Germany and the western Habsburg lands from the lower consumption recorded across much of Hungary and the southeastern territories.A separate system of graduated red brewery symbols identifies towns by annual beer production, from less than 1,000 hectoliters to more than 1 million. Additional symbols indicate hop cultivation and viticulture, while lines identify important railway connections and beer-tax boundaries. The map thus places consumption alongside the agricultural, manufacturing, transportation, and fiscal geography that supported the trade. Crucially, its background colors measure drinking rather than brewing: a region's consumption and its breweries' output are distinct quantities.
The surrounding panels move between regional detail and international comparison. At upper right, circular diagrams divide the brewing output of Munich, Berlin, Vienna, and other cities among individual firms and groups of breweries. Names such as Spaten, Löwenbräu, Schultheiss, and Dreher attach recognizable businesses to numerical shares. Along the left margin, upright casks compare beer imports and exports at intervals between 1880 and 1896. Wine commerce is represented by vessels of various shapes and, importantly, is measured in monetary value rather than in hectoliters, as with beer.
The lower-left panel is arranged as a still life on a patterned tablecloth. Numbered beer steins, wine bottles, and glasses correspond to lists of annual per-person consumption. Their varying sizes make differences immediately apparent, while the accompanying figures allow precise comparison. Nearby, barrels laid on stepped platforms compare beer consumption in individual European cities, and coins and money bags represent beer taxes and their annual yield. The pictures are integral to reading the statistics, not incidental ornament.
Brewing on an Industrial Scale
The smoking, castle-like breweries in the lower right illustrate the expansion of beer production between 1875 and 1896. Successively enlarged buildings represent increasing output in the two empires. The German series rises from approximately 28.9 million to 61.3 million hectoliters, while Austria-Hungary increases from approximately 12.2 million to 20.6 million. The tables above the map separately compare the number of operating breweries and the average output per establishment, inviting the reader to consider both the scale of production and its total volume.This expansion accompanied the industrial modernization of brewing, particularly the introduction of mechanical refrigeration. Previously dependent on winter ice and cool cellars, lager brewers could increasingly control fermentation and storage temperatures year-round. Refrigeration supported larger-scale production and wider distribution, although natural ice remained in use at many breweries into the 20th century.
The towering barrels on the right place this Central European industry in a worldwide context. Germany, Great Britain and Ireland, and the United States dominate the largest stack; smaller barrels and accompanying lists account for other countries. A corresponding wine-production display at left gives France, Italy, and Spain visual prominence. These paired constructions make the different international geographies of brewing and winemaking legible without requiring the reader to work through a conventional statistical table.
Viticulture and the Phylloxera Crisis
Wine production faced a different set of pressures. Phylloxera, a North American vine pest that attacks the roots of susceptible European grapevines, had spread through European vineyards during the preceding decades. In Austria, it was first identified at Klosterneuburg in 1872 and documented across the Danube in the Weinviertel in 1882. Costly treatments with carbon disulfide failed to provide a lasting solution; grafting European grape varieties onto resistant American rootstocks became the basis for restoring affected vineyards.By the period represented on this chart, replanting and rootstock selection were reshaping Central European viticulture. In Hungary, where phylloxera had destroyed extensive vineyard areas, grafted planting became common; rootstock breeder Sigmund Teleki began work with imported American vine seeds in 1896. Hickmann's upper-left wine-production graphs record fluctuating harvests rather than the sustained expansion pictured in his brewery series. These figures pertain to an industry facing both the variability of annual harvests and disruptions to its established vineyards, although the chart does not separately quantify the effects of phylloxera.
Hickmann's Pictorial Statistics
Anton Leo Hickmann (1834 - 1906) was a Bohemian-born Austrian geographer, statistician, and educator who taught for nearly 30 years at the gymnasium in Reichenberg, now Liberec. Hickmann is admired for his extraordinary ability to communicate complex statistical ideas graphically, in his maps and charts. His comparative wall maps and charts placed pictures before numerical tables, using familiar objects to make statistical relationships accessible. Here, the choice of barrels, drinking vessels, factories, and money gives each category its own visual vocabulary while retaining the figures needed to check the comparison.Chromolithography
Chromolithography, sometimes called oleography, is a color lithographic technique developed in the mid-19th century. The process uses multiple lithographic stones, one for each color, to yield a rich composite effect. Generally, a chromolithograph begins with a black basecoat upon which subsequent colors are layered. Some chromolithographs used 30 or more separate lithographic stones to achieve the desired effect. Chromolithograph color can be blended for even more dramatic results. The process became extremely popular in the late 19th and early 20th centuries when it emerged as the dominant method of color printing. The vivid color chromolithography made it exceptionally effective for advertising and propaganda.Publication History and Census
This separately issued map was compiled by Hickmann and printed and published by G. Freytag and Berndt in Vienna, whose red imprint appears in both upper corners. The sheet is undated; its trade statistics extend through 1896, consistent with our c. 1897 attribution. The OCLC catalogs four examples with an assigned date of 1896, but these likely represent the same map, as here. Although this date appears on the map, it is simply the date of the most recent available statistics. The David Rumsey Map Collection holds the same map, with the 1897 date, as here. We also see two examples dated 1898 in European libraries, though, as these are not digitized, it is impossible to determine whether they represent a new edition or an assumed date. On the market, this map is very scarce.Cartographers
Anton Leo Hickmann (March 23, 1834 - July 18, 1906) was a Bohemian-born Austrian geographer, statistical cartographer, and educator active in Bohemia and Vienna during the second half of the 19th century and the early 20th century. Born in Theresienstadt, Bohemia, in the Austrian Empire (now Terezín in the Czech Republic), he studied in Prague and obtained his habilitation in modern languages and political economy. After briefly serving as secretary of the chamber of commerce in Eger, now Cheb, he taught at the gymnasium in Reichenberg, now Liberec, for approximately 30 years and also served as a school inspector. His cartographic work emphasized economic geography, thematic mapping, and the visual presentation of statistics for educational and general audiences. Early publications included the Industrie-Atlas des Königreiches Böhmen (1862 - 1864); he subsequently produced geological and mining maps of Bohemia, school relief maps, and election result maps. In his comparative charts, pictures and diagrams carried much of the explanatory burden, with numerical tables playing a supporting role. His widely circulated Geographisch-statistischer Taschen-Atlas, published by Freytag and Berndt in Vienna and appearing in editions from the 1890s onward, combined geographical maps with statistical graphics. A Czech adaptation appeared in 1899 as Geograficko-statistický všeobecný atlas kapesní. His later publications included a survey of Austria-Hungary's intellectual and material development during the 19th century and a collection of 41 geographical-statistical plates on Vienna, issued in 1903, accompanied by a large city plan. Hickmann died in Vienna on July 18, 1906. His atlas continued to appear after his death, including a thoroughly revised edition prepared by Alois Fischer (born 1894) and published by Freytag and Berndt in 1927. Further Details...
Freytag and Berndt (1770 - Present) is a publisher of maps, atlases, guidebooks, and travel literature. Its roots reach back to when Francesco Artaria founded a lithographic works in Vienna in 1770. In February 1879, Gustav Freytag founded a cartographic publishing house. Freytag and Berndt merged with Artaria's cartographic division in 1920. After World War II, Freytag-Berndt and Artaria expanded their publishing operations, becoming one of the most important cartographic publishers in Central Europe. Today, Freytag & Berndt publishes street maps, city maps, hiking maps, and cycling maps and employs 50 cartographers and editors at its headquarters in Vienna. Further Details...
Condition
Good. Wear and some splits on old fold lines, stabilized on verso. A few minor points of loss at fold intersections.
References
Rumsey, 16790.000. Rumsey, 16790.002 (covers). Österreichisches Biographisches Lexikon 1815 - 1950, vol. 2 (1959), p. 312, 'Hickmann, Anton Leo'. OCLC 1594243973.