
1931 Izostat Soviet Persuasive Map of World Unemployment and Hunger, Great Depression


This item has been sold.
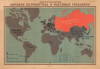
Диаграмма Мировая Безработица и Массовые Голодовки / [Chart of Global Unemployment and Mass Famines].
Soviet Exceptionalism: Denouncing Hunger Abroad, Ignoring Hunger at Home.
- Digital Map Information
- Suitable for large format printing
- File Size: 62.35 MB
- File Type: ZIP / TIFF
- ICC color profile embedded
- Delivered instantly via download link
Soviet Exceptionalism: Denouncing Hunger Abroad, Ignoring Hunger at Home.
A unique survivor, this is the only known example of this 1931 IZOSTAT Soviet Exceptionalism propaganda poster map of the world presenting the Soviet Union as an exception in a world beset by hunger and unemployment. Produced during the Great Depression (1929 - 1939), it was meant to tout the benefits of Stalin's intensive collectivization and industrialization drive (First Five-Year Plan, 1928-1932), which itself caused widespread famine, particularly in Ukraine. The producer, IZOSTAT was a propaganda arm of the U.S.S.R. government focused powerful persuasive infographics.A Closer Look
The poster consists of a world map on a Mercator projection with the Soviet Union shaded a vibrant red amid a sea of grey. National borders are drawn in Europe, North America, and parts of Asia, while other parts of the world are grouped into larger regions or entire continents. Across the map, stooped figures represent unemployed workers (one figure equaling 200,000 people) - fully black being unemployed since 1929 and those with red arms unemployed since 1930 - and people suffering from hunger (one figure equaling 250,000 people). Tables at the bottom-right provide statistics on unemployment and hunger for particular countries, with the U.S., U.K., and Germany (i.e., the leading economies of the capitalist world) placed at the top of the unemployment chart, and China (in the midst of an anti-Communist purge) along with India and Indochina, important Western colonies, at the top of the hunger chart.Superimposed on the Soviet Union is a pair of quotes taken from Joseph Stalin's 'Political Report of the Central Committee to the 16th Congress of the VKP(b) [the All-Union Communist Party]', on June 27, 1930:
In contrast to capitalist countries - where economic crisis and rising unemployment now prevail - the internal situation of our country presents a picture of growing economic upsurge…
The reason lies in the bankruptcy of the capitalist economic system.
The reason lies in the advantages of the Soviet economic system over the capitalist system.
The overall message is entirely clear; capitalism and imperialism are collapsing while socialism is ascendant. Not specifically mentioned (though obvious to any viewer) is the context of the First Five-Year Plan, Stalin's crash industrialization program. The sad irony of the poster is that it very effectively highlights hunger in other parts of the world while also celebrating Soviet policies, which were causing mass hunger and famine within the Soviet Union.
Stalin's First Five-Year Plan
The First Five-Year Plan (1928 - 1932) marked Joseph Stalin's definitive break from the semi-market policies of the Lenin era toward a total command economy. Launched while the Western world was spiraling into the Great Depression, the plan was marketed as a soaring success of socialist efficiency when compared to the 'collapse' of global capitalism. As breadlines stretched across New York and Berlin, Soviet propaganda boasted of full employment and the birth of massive planned industrial hubs like Magnitogorsk. However, this breakneck industrialization was financed almost entirely through increased demands on the 'internal colony' of the peasantry. To pay for imported heavy machinery, the state forcibly seized grain and livestock, effectively enslaving the rural population to fuel the furnaces of the new Soviet industry.The human cost of this transition was horrific, setting off famines throughout the Soviet Union, the most severe being the Holodomor, a famine that devastated Ukraine in 1932-1933. Driven by radical collectivization, the state branded successful farmers as 'kulaks' and liquidated them as a class, destroying the most productive elements of the rural economy. In Ukraine and elsewhere, the Soviet government implemented draconian grain procurement quotas and forcibly restricted migration to prevent starving peasants from seeking food elsewhere. While Stalin continued to export millions of tons of grain to maintain the facade of a thriving economy to the West, approximately 3.5-5 million Ukrainians perished from hunger. Historians debate the extent to which Stalin targeted Ukraine for its perceived political unreliability. Still, it is certainly possible that the famine there was at least in part a political tool used to crush Ukrainian national resistance.
Soviet Infographics
One notable feature of propaganda posters of the early Soviet Union is the prevalence of infographics, particularly for economic data. For Lenin, making statistical information accessible and interesting was a key component of propaganda work. The Bolsheviks faced the monumental task of explaining abstract economic shifts like the transition from agrarian feudalism to rapid industrialization to a population that often was illiterate or semi-literate. To do so, Soviet authorities enrolled young and innovative artists influenced by the 'Vienna Method of Pictorial Statistics' pioneered by Austrian left-wing philosopher and political economist Otto Neurath (1882 - 1945), who developed the 'Isotype' (International System of Typographic Picture Education) approach at the Gesellschafts- und Wirtschaftsmuseum, which he founded with funding from the municipality of Vienna during the 'Red Vienna' era of the 1920s. With his wife, Marie Reidemeister (1898 - 1986), and other associates, Neurath heavily influenced the development of data visualization in the young Soviet Union, helping to establish IZOSTAT, which produced this map, in 1931. Afterwards, Neurath served as the artistic director of IZOSTAT, but primarily lived in Britain, traveling annually to the Soviet Union for extended visits.The 'Vienna Method' functioned as a form of scientific shorthand, stripping away the nuance of reality to present a rhythmic, orderly, and unstoppable march of progress. By utilizing bold, Constructivist graphics and 'Isotypes,' the state transformed dry data into heroic narratives. A soaring bar chart was more than just a representation of coal output, for instance; instead, it was visual proof of the inevitable triumph of socialism over the 'decaying' capitalist world. By standardizing icons, such as using rows of identical little tractors, or soldiers, or, in this case, unemployed or starving people to represent quantity, the state created a sense of massive, collective power that was easily digestible at a glance. In this context, data visualization was the ultimate propaganda tool, carrying the perceived authority of objective science while being aesthetically engineered to inspire awe and mobilize the masses, particularly during the Five-Year Plans.
Publication History and Census
This map was prepared in 1931 in Leningrad by the Department of Visual Statistics (Отдела изобразительной статистики) of IZOSTAT (ИЗОСТАТ), the All-union Institute of Pictorial Statistics of Soviet Construction and Economy (Всесоюзного института изобразительной статистики советского строительства и экономики), affiliated with IZOGIZ (ИЗОГИЗ), the State Publishing House of Fine Arts. Having only been founded the same year, this poster would have been among IZOSTAT's earliest productions. IZOSTAT was founded as an educational institute, but, as seen here, quickly transitioned to propaganda work, especially regarding the First and Second Five-Year Plans. Neurath became disillusioned with its direction, and the institute closed in 1940.The artwork on this map was handled by Nikolai Kochergin (Николай Кочергина), with Ivan Ivanisky (Иван Петрович Иваницкий) serving as editor and A. Dakhno (A. Дахно) as technical editor. It was printed at the 'M. Tomsky' branch of Goslit (the State Literature Publishing House) in Leningrad. Despite a stated print run (Тираж) of 20,000, this is the only known surviving example with no other institutional examples or market history.
Cartographers
Nikolai Mikhailovich Kochergin (Николай Михайлович Кочергин; May 9, 1897 - May 10, 1974) was a Russian-Soviet artist and poster designer who played an important role in developing the distinctive Socialist Realist style of Soviet propaganda posters. Born in Moscow, he studied at the Stroganov School of Art and Industry (Строгановском художественно-промышленном училище, now Stroganov Moscow State University of Arts and Industry) and in 1918 volunteered for the Red Army, being sent to the Higher School of Military Camouflage. During the Russian Civil War, Kochergin was primarily based in Baku and designed a series of iconic posters of the conflict which were widespread in the Caucasus region. During the 1930s, Kochergin engaged in mass-agitation art, designing parades, theater productions, and festivities, while creating propaganda posters and illustrating some children's books. Throughout the 1930s, he continued his work in the poster medium, producing both agitation and statistical-graphic posters. During the Second World War (Great Patriotic War) Kochergin designed patriotic posters, but was himself badly injured during the siege of Leningrad, diminishing his production for a time. After the war, Kochergin primarily focused on a series of monumental paintings and illustrating children's books, becoming a key figure in the Soviet 'golden age' of children's illustration. Further Details...
Ivan Petrovvich Ivanisky (Иван Петрович Иваницкий; 1896 - 1970) was a Soviet graphic artist and pioneer in Soviet propaganda infographics. He was wounded in his right hand while serving in the Russian Imperial Army in the First World War and was forced to become left-handed for the rest of his life. After the war, Ivanisky moved to St. Petersburg (Leningrad) and worked at educational publishers, producing graphic content and games. He became strongly influenced by the 'Vienna Method of Pictorial Statistics' led by the Austrian Otto Neurath, publishing a book on the method in 1931. Ivanisky was an important figure in IZOSTAT (ИЗОСТАТ), the All-union Institute of Pictorial Statistics of Soviet Construction and Economy, founded in 1931, where he served as editor and implemented Neurath's methods to produce propaganda championing the policies of the First and Second Five-Year Plans. Though IZOSTAT closed down in 1940, by aligning closely with the Vienna Method, Ivanisky had influenced the direction of Soviet infographics and propaganda for years to come. Further Details...
Condition
Very good. Expert reinstatement of upper left corner, just impacting printed border. Backed on tissue.