
Earliest Acquirable Printed Map of the African Continent.

Africa XXV. Nova Tabula.
sold
- Digital Map Information
- Suitable for large format printing
- Full resolution TIFF file
- ICC color profile embedded
- Delivered instantly via download link
This is the distinctive 1552 Geographia edition of Sebastian Münster's 1540 map of Africa, the earliest map of the continent available to the collector. For more than thirty years during the age of discovery, this map would be the predominant representation of Africa for the European reader. This issue is the only edition to include the coordinate bars on the margin, which were added to the final 1552 edition of Geographia but were not re-utilized in subsequent Cosmographia editions. (more details)
Highlights the extensive phone network around President Franklin D. Roosevelt's Hyde Park estate just weeks before his untimely death.

Crash, Post and Road Diagram.
sold
- Digital Map Information
- Suitable for large format printing
- Full resolution TIFF file
- ICC color profile embedded
- Delivered instantly via download link
This is a c. 1945 White House Signal Detachment map of the phone network at Springwood, the estate of Franklin D. Roosevelt near Hyde Park, New York. The map was made near the end of President Franklin D. Roosevelt's final term as President of the United States and depicts the Springwood estate from the Hudson River to Cream Road and from Fuller Lane to just south of the estate. The estate is divided into three sections: lower woods, middle woods, and upper woods. Roads in each section are labeled numerically with an 'L', 'M', or 'X' to identify the part of the estate in which it is located, and roads that are only passable by jeep are labeled as such. Solid colored lines shaded red, green, and gray immediately jump out at the viewer, with each section labeled by a capital letter. It is unclear exactly what each section denotes. One possibility is that each letter marks a different telephone switchboard, since each of the small triangles marks a phone jack. These may also mark patrol routes, owing to the fact that the map is accompanied by two sheets of Secret Service code names, and the phone jacks mark points where agents on patrol could report back. Several buildings around the estate are labeled, including the President's House, the security building, the library, the Morgan Estate, the Rogers Estate, the J.R. Estate, Valkill Cottage, and the President's Cottage. (more details)
Network of redeployment camps surrounding Reims, France after V-E Day.

Redeployment Camp Road Network.
sold
- Digital Map Information
- Suitable for large format printing
- File Size: 34.42 MB
- File Type: ZIP / TIFF
- ICC color profile embedded
- Delivered instantly via download link
A 1945 record of a little-known chapter in World War II. This map details the network of 'city' redeployment camps established in Europe after Germany's surrender and the end of World War II in Europe. The Road Movements Division map of Reims, France, and its environs, tells the story of how millions of European theater American soldiers returned home. These 'city camps,' named for American cities, including Detroit, Norfolk, Oklahoma City, Cleveland, Pittsburgh, St. Louis, and Boston, appear as black boxes. Dashed black lines, representing roads, connect the camps and the major towns. Traffic control points and traffic regulating points are also labeled, which makes sense given that thousands of trucks would have been traveling these roads in the summer of 1945. Intriguing manuscript notations in blue pencil appear along the bottom border and surround the Atlanta, New Orleans, and Miami redeployment camps. Unfortunately, we have been unable to decipher the meaning of these markings. (more details)
The care and feeding of your battleship and its crew.

Your Battleship And Her Requirements. / NEWSMAP for the Armed Forces. Monday, May 22, 1944. 245th Week of the war - 127th Week of U.S. Participation.
sold
- Digital Map Information
- Suitable for large format printing
- Full resolution TIFF file
- ICC color profile embedded
- Delivered instantly via download link
This is a 1944 Army Orientation Branch newsmap propaganda broadside of a North Carolina class battleship. The battleship steams across an American flag and fires a salvo from its two forward gun batteries. Smaller gun batteries flank the ship's superstructure, and smaller anti-aircraft batteries dot the rest of the ship's deck, from bow to stern. Infographics concerning the construction and operation of a 'BB' (U.S. Navy abbreviation for battleships) appear in the right quadrant, over the stripes of the flag. Nearly the first three rows detail parts of a battleship's construction (which took a force of 6,250 shipbuilders 3.5 years to finish) and required 1,135,000 rivets; 1,220,000 feet of electrical cable; 422,000 feet of piping; 5,300 electric light fixtures; and 1,091 telephones. Operational statistics, given per year, include: 9,000,000 gallons of fuel oil; 60,000 pounds of butter; 300,000 candy bars; 100,000 bars of soap; and 75,000 pounds of coffee. (more details)
Union hospital during the Civil War.

Harewood Hospital, Washington D.C.
sold
- Digital Map Information
- Suitable for large format printing
- File Size: 15.71 MB
- File Type: ZIP / TIFF
- ICC color profile embedded
- Delivered instantly via download link
This is an 1864 bird's eye view of Harewood General Hospital by Charles Magnus. Harewood General Hospital was a pavilion-style hospital operated by the United States during the American Civil War to render care for Union personnel, which was in operation from September 4, 1862, to May 5, 1866. The view shows the V-shaped layout of the Hospital's barracks-like wards, as well as an array of orderly tents extending across fields and into the neighboring woods. (The site of the hospital can be found east of Georgia Avenue NW north of the Glenwood Cemetery and south of the Armed Forces Retirement Home. Washington Hospital Center, the Washington DC VA Medical Center and the Children's National Medical Center can be found there now.) (more details)
A pictorial map of Iran published either by or for the U.S. military.

Cartographical Map of Iran Once Known as Persia 1322 - 1944 Showing Many Places of Biblical and Historical Interest.
sold
- Digital Map Information
- Suitable for large format printing
- File Size: 14.97 MB
- File Type: ZIP / TIFF
- ICC color profile embedded
- Delivered instantly via download link
This is a 1944 Persian Gulf Command pictorial map of Iran. The map depicts the region from Turkey, Iraq, and Saudi Arabia to Afghanistan and from the Soviet Union to the Persian Gulf and the Gulf of Oman. Cities throughout Iraq are labeled and illustrated with pictorial vignettes. Most of these municipalities are also accompanied by a small caption giving some information about them. Teheran (Tehran), for example, is labeled simply as the capital of Iran, but Persepolis is noted as the capital of Iran during the reign of Darius, Shush is labeled as the site of Daniel's tomb, and Isfahan is noted for its mosque as well as its pottery, silk mills, and silversmiths. Other cities are also noted for their resources, such as Resht, which is known for its lace, and Shiraz, which is known for opium and vineyards. Cars, trucks, and people riding horses are illustrated using the roads connecting the towns, while trains are drawn on the rail lines, with one appearing on the route between Basra and Tehran. (more details)
Early tourist map of the White Mountains highlighting railway lines.
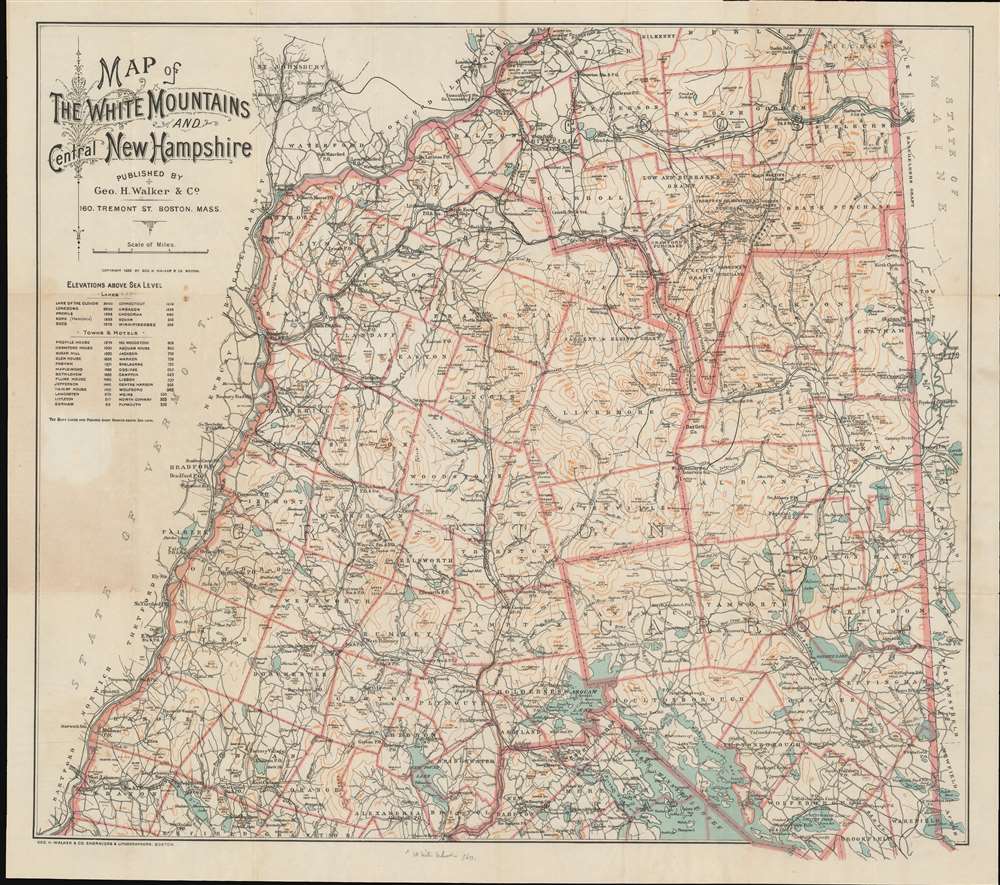
Map of the White Mountains and Central New Hampshire.
sold
- Digital Map Information
- Suitable for large format printing
- Full resolution TIFF file
- ICC color profile embedded
- Delivered instantly via download link
This is a scarce 1893 George H. Walker tourist map of the White Mountains and central New Hampshire. Walker depicts the region from Vermont to Maine and from Lancaster to Lake Winnipesaukee. Townships are outlined in orange and identified, along with purchases, grants, and other locations, many of which are still recognized. Some include Thompson and Meserve's Purchase, Sargent's Purchase, and Crawford's Purchase, as well as the Sargent and Elkins Grant, Low and Burbank's Grant, and Green's Grant. Towns are labeled throughout, many of which highlight the presence of post offices and railroad stations. The Maine Central Railroad, the Boston, Concord, and Montreal Railroad and the Concord and Montreal Railroad traverse this area of New Hampshire, allowing for an ease of access into the region never before possible. (more details)
Helped to establish Adirondack Park and the Forest Preserve.
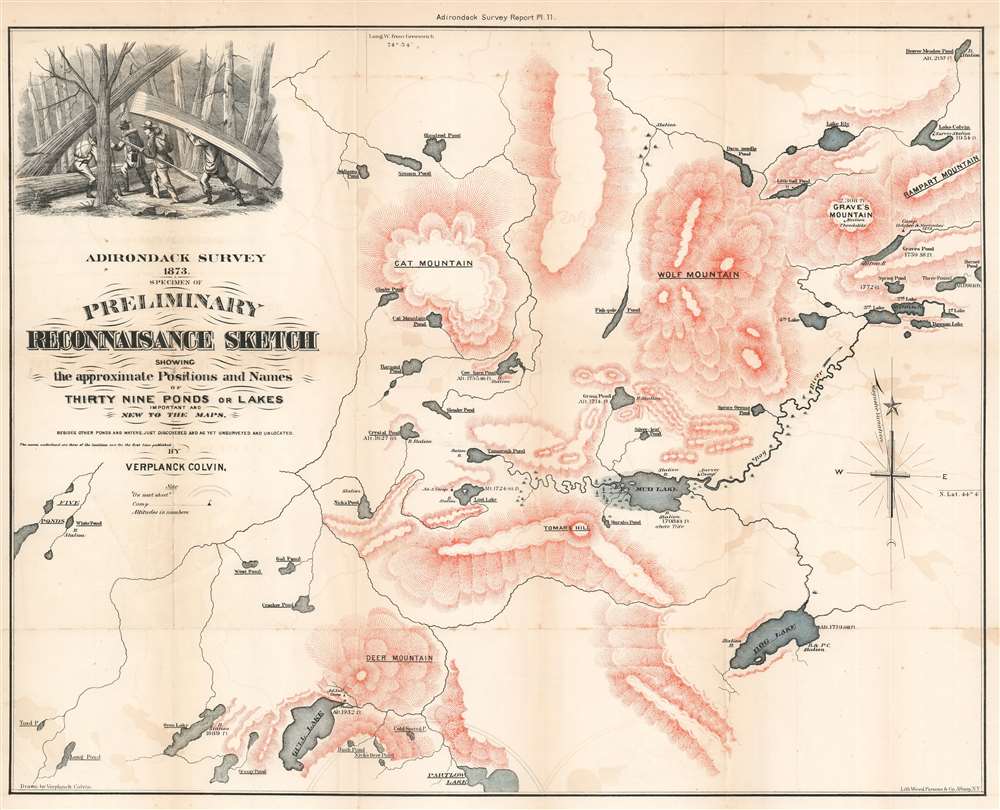
Adirondack Survey 1873. Specimen of Preliminary Reconnaisance Sketch Showing the approximate Positions and Names of Thirty Nine Ponds or Lakes Important and New to the Maps.
sold
- Digital Map Information
- Suitable for large format printing
- File Size: 22.37 MB
- File Type: ZIP / TIFF
- ICC color profile embedded
- Delivered instantly via download link
This is an 1873 Verplanck Colvin map of the Five Ponds Wilderness in the Adirondacks, New York. Depicting the region from the Five Ponds to Rampart Mountain and from Beaver Meadow Pond to Partlow Lake, Colvin (1847 - 1920) identifies over thirty lakes and five mountains that had never before appeared on a published map. Altitudes are provided for several of the lakes, allowing for a better understanding of the area's topography. Curiously, given Colvin's obsession with accurately measuring a mountain's altitude, none of the mountains presented here also have noted altitudes - suggesting this is an early 'preliminary' version of Colvin's work. In the upper right, a beautifully engraved vingette in the upper left depicts Colvin's surveying party portaging through the dense Adirondack wilderness. (more details)
Details the Nazi invasion of Belgium and the Netherlands in May 1940 at the beginning of the Spring Offensive.
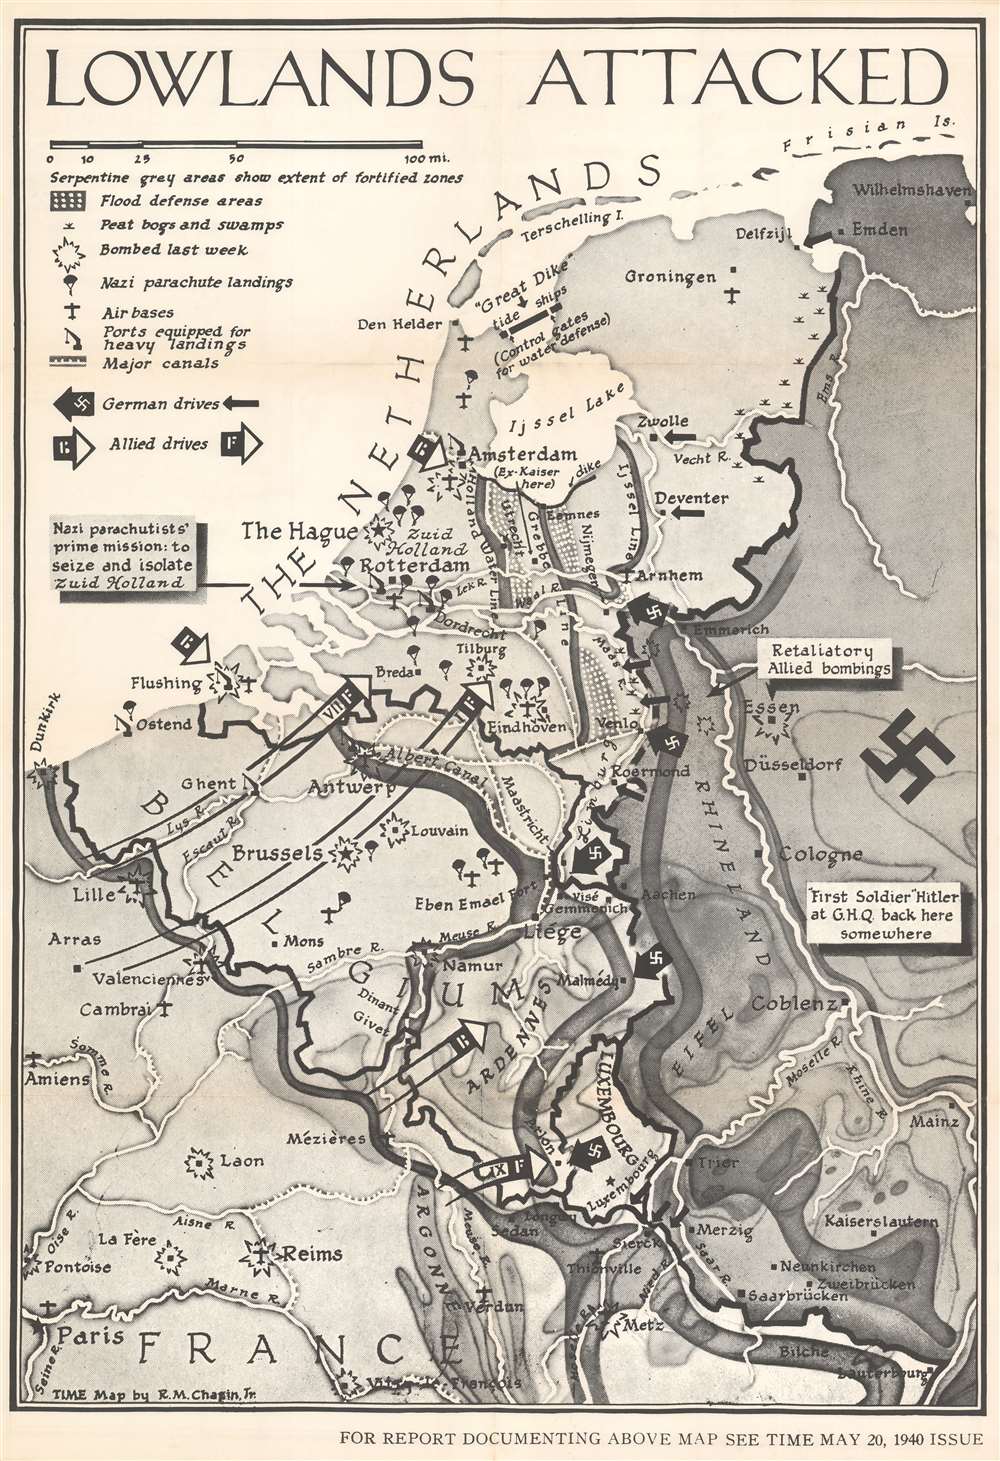
Lowlands Attacked.
sold
- Digital Map Information
- Suitable for large format printing
- File Size: 66.18 MB
- File Type: ZIP / TIFF
- ICC color profile embedded
- Delivered instantly via download link
This is a large-format separate issue 1940 Robert M. Chapin Jr. pictorial map of Belgium and the Netherlands during the German invasion of Western Europe. Published only ten days after the Nazis launched their assault, the map depicts the region from Dunkirk to Wilhemshaven and from the North Sea to Paris. Thick black arrows marked with swastikas identify the German drive west, while white tipped arrows highlight the British and French response. Explosions mark cities and airfields bombed the week before, and icons of paratroopers present where German parachute landings took place. (more details)
One of the most detailed 19th century atlas maps of the American West.
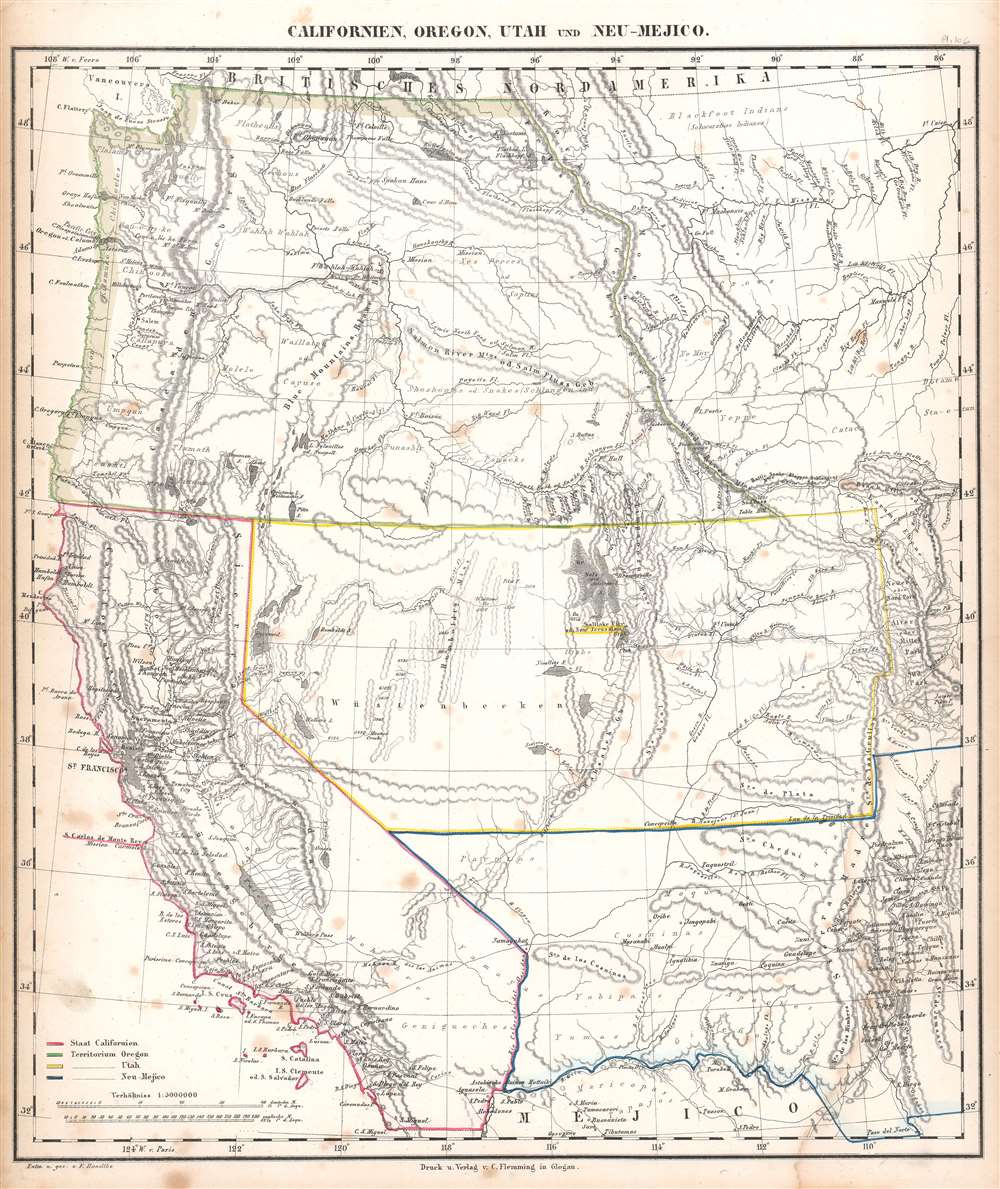
Californien, Oregon, Utah, und Neu-Mejico.
sold
- Digital Map Information
- Suitable for large format printing
- Full resolution TIFF file
- ICC color profile embedded
- Delivered instantly via download link
This is a c. 1850 Carl Flemming map of the western United States during a period of incredible change in the American West. Published soon after California became a state, the map depicts the region from the Pacific Ocean to the Rocky Mountains and from Canada to Mexico. Flemming employs outline color to highlight the State of California and the Oregon, Utah, and New Mexico Territories. Flemming's map is one of the most comprehensive 19th-century atlas maps of this part of the United States. It labels cities and towns and details the region's incredible topography, identifying several mountains in modern-day Colorado while including some fictional mountain ranges in modern-day Nevada. However, the identification of 'Saltlake City or New Jerusalem' in Utah presents the map's most astonishing detail. (more details)
Revealing the newly-mapped Silk Road regions of the Gobi Desert.
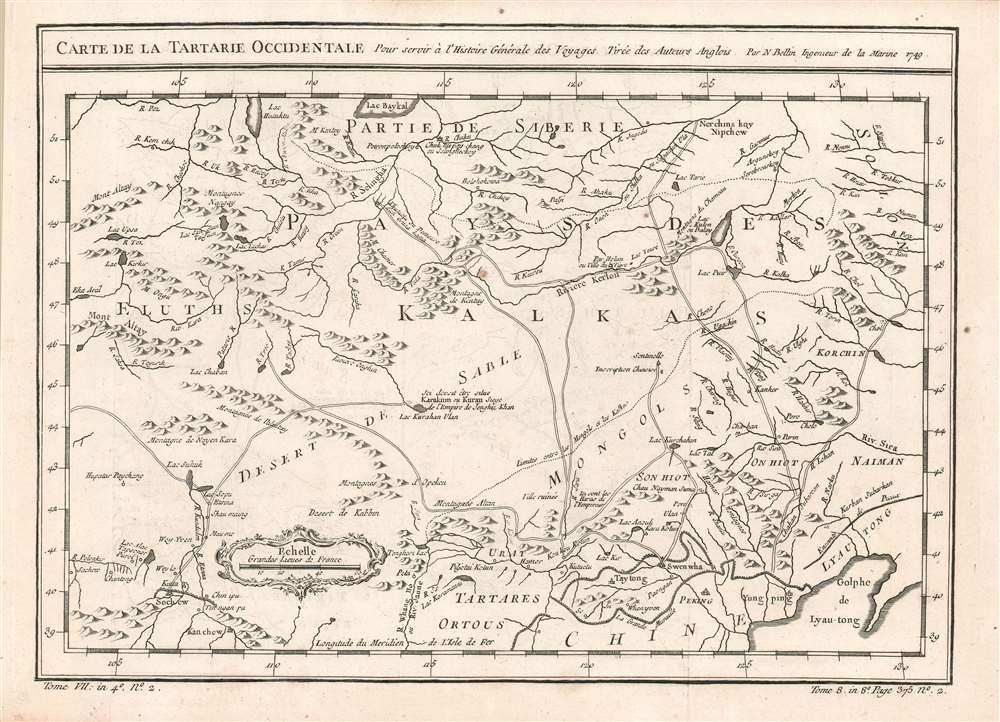
Carte de la Tartarie Occidentale, Pour servir à l'Histoire Générale des Voyages Tirée des Auteurs Anglois. Par N. Bellin Ingenieur de la Marine 1749.
sold
- Digital Map Information
- Suitable for large format printing
- Full resolution TIFF file
- ICC color profile embedded
- Delivered instantly via download link
This is a 1749 Bellin map of the Gobi Desert and the eastern portion of the Silk Route region 'Tirée des Auteurs Anglois.' For 'Auteurs Anglois' read 'Thomas Kitchin', who produced the 1747 A Map of Western Tartary which the present map copies faithfully, and translates. Kitchin's map, itself, was drawn from Jesuit Missionary reports and the monumental 1734 Kirilov map of the Russian Empire. (more details)
A map of Southeast Asia during the Vietnam War that was created for schoolchildren and clearly separates the communist countries from the capitalist countries in the region.
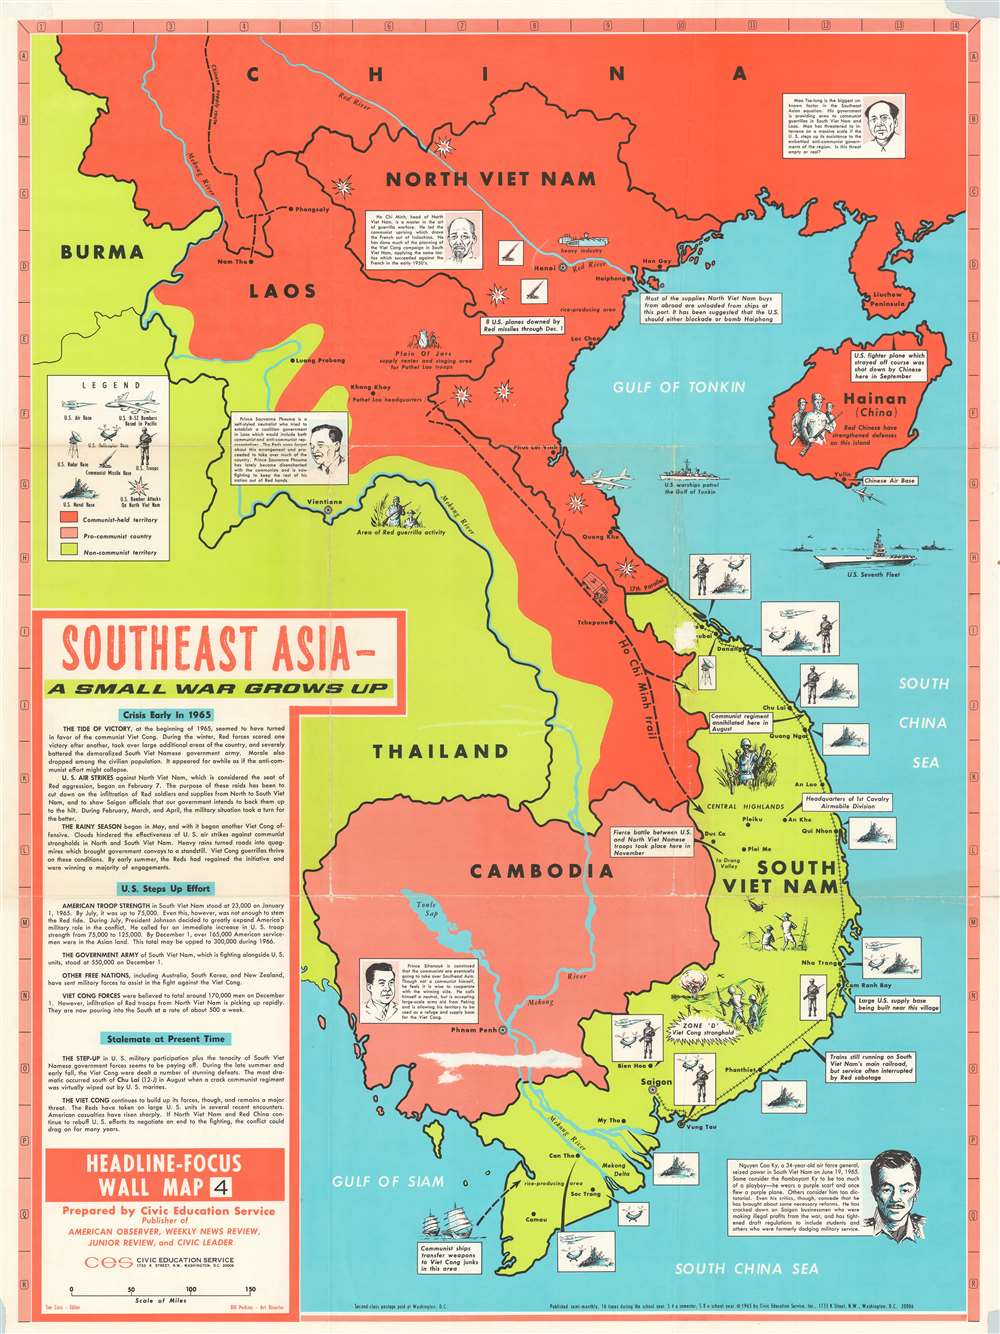
Southeast Asia - A Small War Grows Up. Headline-Focus Wall Map 4.
sold
This is a 1965 Civil Education Service pictorial map of Southeast Asia. The map depicts the region from Burma and Thailand to the South China Sea and from China to the Gulf of Siam and the Ca Mau Peninsula. A product of the Cold War and the Vietnam War, the ideological fight between communism and capitalism is immediately apparent, with communist countries shaded red and capitalist countries shaded an almost neon green – ‘the color of money’, ironically. China and North Vietnam are colored red, while Laos is half red and half green, a vivid illustration of the fight between the Pathet Lao forces and the anti-communist government backed forces in that country. Thailand, Burma, and South Vietnam are all green, while Cambodia is a dull red, indicating its pro-communist stance but its officially neutral stance. Icons along the South Vietnamese coast indicate the locations of American naval, helicopter, and air bases situated throughout the country, as well as troop concentrations. Text boxes provide some context, highlighting for example the headquarters of the 1st Cavalry Airmobile Division and locations of important battles between communist and American forces. Other vignettes highlight the now famous Ho Chi Minh Trail, the North Vietnamese supply route from North Vietnam, through Laos, into South Vietnam, areas of guerrilla activity, and the U.S. Seventh Fleet stationed over the Vietnamese Coast. Short biographies of important leaders, including Ho Chi Minh, Nguyen Cao Ky, a South Vietnamese air force general who seized power in June 1965, Prince Sihanouk of Cambodia, and Prince Souvanna Phouma of Laos are included as well, and are accompanied by portraits. A text box in the lower left corner provides context and information concerning America’s escalating role in the region and an assessment of the current state of affairs there. (more details)
One of the most beautiful, important, and enduring maps of Manhattan ever published.

Topographical Map of the City of New York showing original water courses and made land.
sold
- Digital Map Information
- Suitable for large format printing
- Full resolution TIFF file
- ICC color profile embedded
- Delivered instantly via download link
This is a very beautiful and fine example of Egbert L. Viele's 1865 topography and waterways map of Manhattan, one of the scarcest, most important, and most enduring maps of New York City ever published. Covering the entirety of Manhattan Island, Viele's map details the canals, swamps, rivers, ditches, ponds, meadows, and drainage basins of Manhattan as they existed prior to the city's urban development. A version of the Viele map remains in use today by architects and contractors who need to be certain they are not building over underground rivers and swamps that may destabilize a new construction's foundation. (more details)
The most important early map of Western New York State, in the finest example we have handled.
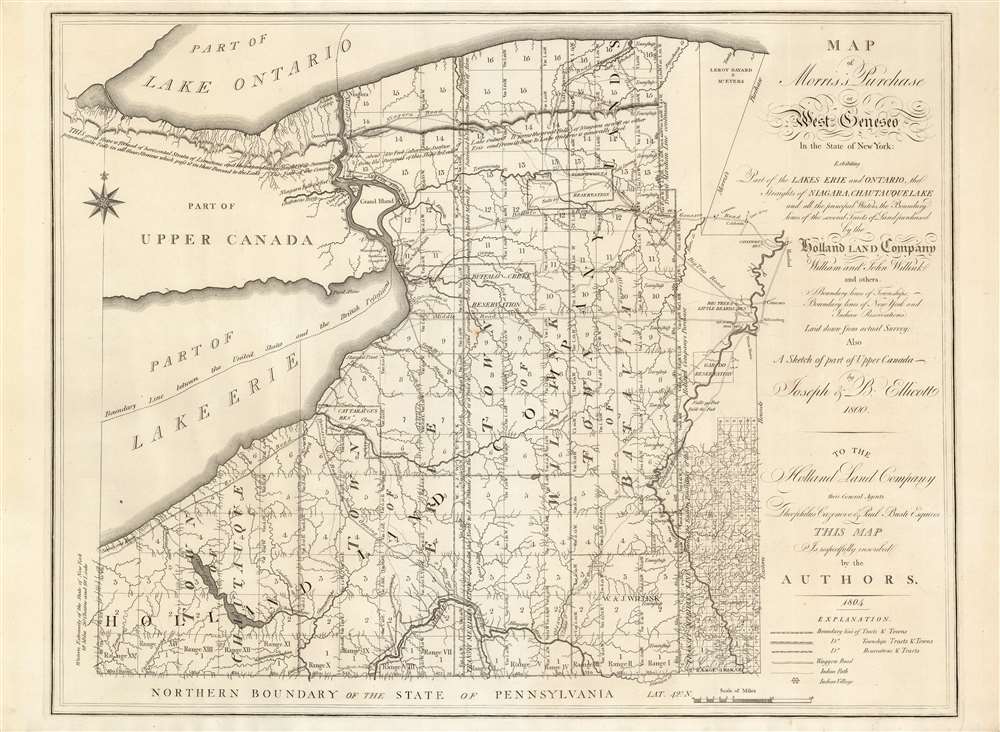
Map of Morris's Purchase or West Geneseo In the State of New York.
sold
- Digital Map Information
- Suitable for large format printing
- Full resolution TIFF file
- ICC color profile embedded
- Delivered instantly via download link
This is Joseph Ellicott's rare map of New York State west of the Genesee River, in a magnificent example. It is a remarkable cartographic achievement. Rumsey admiringly notes:
The map is highly detailed, showing every tributary of every tributary of every stream. All the township and range lines are laid down, every town located, all reservations shown and all roads indicated. One has the impression that the ground was expertly surveyed with care and diligence.Vail hails the map as the 'Most important map of the Holland Land Company, published for the promotion of sale of their Western New York lands.' Nestler praises it as 'the most important map of western NY when Buffalo was still known as New Amsterdam, and when land companies were luring settlers to this new frontier.' (more details)
Rare first Harrison edition of De Berniere's map of the Battle of Bunker Hill.
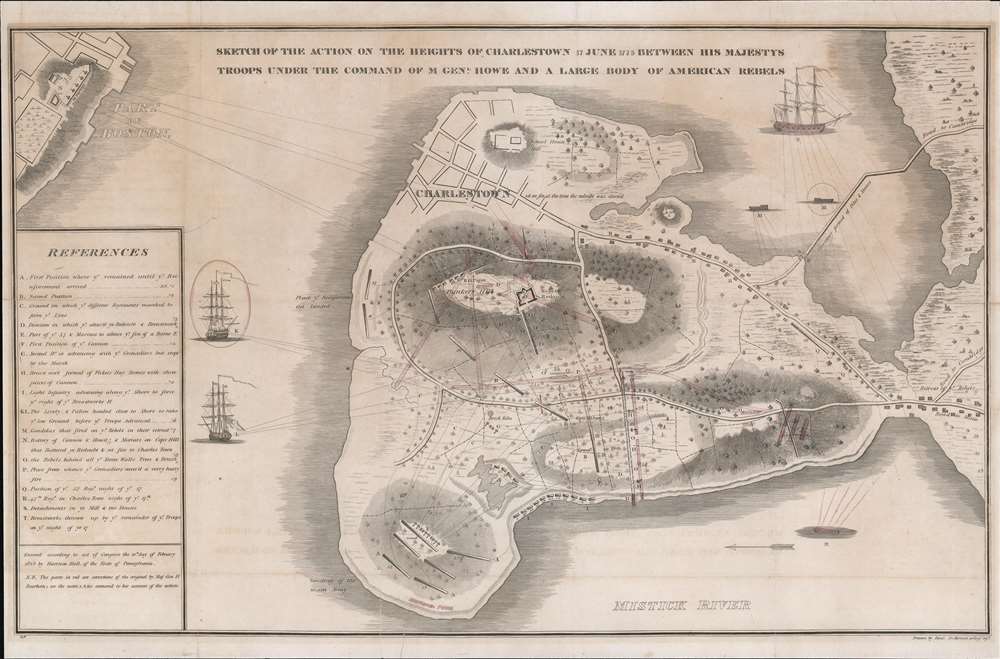
Sketch of the Action on the Heights of Charlestown 17 June 1775 Between His Majesty's Troops Under the Command of M. Genl. Howe and a Large Body of American Rebels.
sold
- Digital Map Information
- Suitable for large format printing
- DPI: 600
- File Size: 14.83 MB
- File Type: ZIP / TIFF
- ICC color profile embedded
- Delivered instantly via download link
This is a rare 1818 map of the 1775 American Revolutionary War Battle of Bunker's Hill, Boston. Cartographically, the map is derived from a sketch by Henry De Berniere, a reconnaissance Ensign (spy) under British commanding General Thomas Gage. The original manuscript, from all reports, was discovered in a trunk in the early 19th century. De Berniere witnessed Bunkers Hill first-hand and prepared the map for his report to Gage. The map is distinctive for its exacting attention to detail and topography, including the layout of Charlestown, as well as its overall fine execution, illustrating all troop movements, underscoring's De Berniere's officer's education as a military engineer and draftsman. When the map was discovered in an old trunk, it was instantly recognized as the finest record of the battle available and became the model for most subsequent illustrations of the events. (more details)
Shanghai at the moment of the Shanghai Ceasefire Agreement in which the city became a demilitarized zone.

New Map of Shangahi. / 上海新地圖
sold
- Digital Map Information
- Suitable for large format printing
- File Size: 36.6 MB
- File Type: ZIP / TIFF
- ICC color profile embedded
- Delivered instantly via download link
An extremely rare bi-lingual Chinese/English map of Shanghai, China, here in its second edition, issued by the Shanghai-Japanese cartographer Sugie Fusazō (杉江房造) in February of 1932, or Showa 7. The map follows the January 28 Incident, also known as the Shanghai Incident (January 28 - March 3, 1932), a conflict in the Shanghai International Settlement between the Republic of China and the Empire of Japan. This is also the second of Sugie Fusazō's maps to include a panorama of the city (more specifically the Bund), and the first to depict the bund from across the Huangpu River, a convention coped from the 1932 Cross House map (Shanghai-crosshouse-1932) of Shanghai, and one that would be followed in many later editions of the map. The map focus is on the extraterritorial Foreign Concessions huddled around the confluence of the Hunagpu River (Whangpoo) and Soochow Creek (Suzhou). The Japanese area is highlighted in orange, the British in red, the American in Pink, and the large separate French Concession in Yellow. The map extends westward along the Extraterritorial Roads, also administered by the Concessions, as far as the Jessfield Road (Zhongshan) Toyoda Factory, precursor of the modern conglomerate Toyota. (more details)
Likely the first printed map of a coronavirus pandemic.

Map Showing Recorded Dates of Influenza Epidemic in 1889 and 1890.
sold
- Digital Map Information
- Suitable for large format printing
- File Size: 11.65 MB
- File Type: ZIP / TIFF
- ICC color profile embedded
- Delivered instantly via download link
A piece apropos to our current times, this 1891 map of the world is likely the first printed map illustrating the global spread of a coronavirus. A deceptively simple work, the map tracks the spread of the Russian Flu Epidemic from 1889 through 1890 as it swept across Asia, Europe, and the Americas. Unlike many world maps, identified locations appear sparingly. Red (for 1889) and blue (for 1890) text, either a specific date or only a month, identify the first known cases of the Russian Flu to be identified in said locations. One can follow the progression of the disease around the world and find it striking the degree to which it mirrors the current Covid-19 infection. (more details)
A lively and detailed panorama of Istanbul, Turkey.

Constantinopolitanae urbis effigies ad vivum expressa, quam turcae Stampoldam vocant, Ao. MDCXXXV.
sold
- Digital Map Information
- Suitable for large format printing
- Full resolution TIFF file
- ICC color profile embedded
- Delivered instantly via download link
This is a 1638 (dated 1635) Matthaus Merian view of Constantinople, or Istanbul, Turkey. The view is oriented to the south. The Beyoğlu district - then known as 'Pera' - is in the foreground, while a panorama of Istanbul proper can be seen as a distant skyline beyond the Golden Horn. A legend at the bottom names twenty nine structures pictured in the view, with a number key indicating the named buildings on the view - predominantly mosques. It is a beautiful example of Merian's superb engraving. The panorama is artfully framed with lifelike trees and other flora, and is filled with depictions of the city's denizens going about everyday life: walking and talking with one another, sitting and conversing, and bringing the dogs back home from the hunt. (more details)
First plate of the elder Merian's self-referential panorama of Paris.

Parys.
sold
- Digital Map Information
- Suitable for large format printing
- Full resolution TIFF file
- ICC color profile embedded
- Delivered instantly via download link
This is a 1638 Matthaus Merian view of Paris, France - arguably the most desirable of Merian's panoramas, in that it is also a self-portrait. The view is oriented to the southwest, showcasing the Hôpital Saint-Louis with the city laid out beyond it. The view was probably drawn from atop the Chauve-mont, now the site of Paris' Parc des Buttes Chaumont; it was almost certainly drawn by Merian himself: the view bears the Latin inscription Math. Merian as vivum delineav. To underline this, Merian has included himself in the picture, seated upon a rock sketching the view before him. Rather than border the view with stylized or fanciful floral decoration, Merian has chosen to frame the panorama in realistic semi-wild trees and bracken of the hillside from which he drew the view, again emphasize that it was drawn from life.
And it is a remarkable view! Fifty-six structures and places are listed below the view with a number key: Notre Dame can be easily found, as can be La Bastille, and other structures both inside and outside the city walls. The Seine can be seen, winding through the city and off into the distance. Diminuitive figures can be seen moving along the roads and on the grounds of the Hôpital Saint-Louis, on foot, horseback and carriage. (more details)
And it is a remarkable view! Fifty-six structures and places are listed below the view with a number key: Notre Dame can be easily found, as can be La Bastille, and other structures both inside and outside the city walls. The Seine can be seen, winding through the city and off into the distance. Diminuitive figures can be seen moving along the roads and on the grounds of the Hôpital Saint-Louis, on foot, horseback and carriage. (more details)
A previously uncatalogued state of a fascinating map of Pennsylvania's Coal Region.

The Anthracite Coal Fields of Pennsylvania with their Outlets to Market.
sold
- Digital Map Information
- Suitable for large format printing
- File Size: 21.31 MB
- File Type: ZIP / TIFF
- ICC color profile embedded
- Delivered instantly via download link
This is an 1879 George B. Strauch and A.B. Cochran map of Pennsylvania's coal region. The map depicts the region from Dauphin County to Wayne County and from Luzerne County and the Northern Coal Field to Berks County and Lebanon County. Six colors highlight the six different districts within the coal region, all of which are identified in a table situated along the top border. Mines are labeled within the districts, along with towns and other settlements. An inset on the lower right situates the anthracite coal fields regionally and details the transportation hubs that bring this incredibly important raw material to market. Data concerning each of the coalfields, including the collieries and their operators, appears along the bottom border and provides a better understanding of the economics involved in anthracite mining. (more details)