
The most important map of Delaware County, PA.
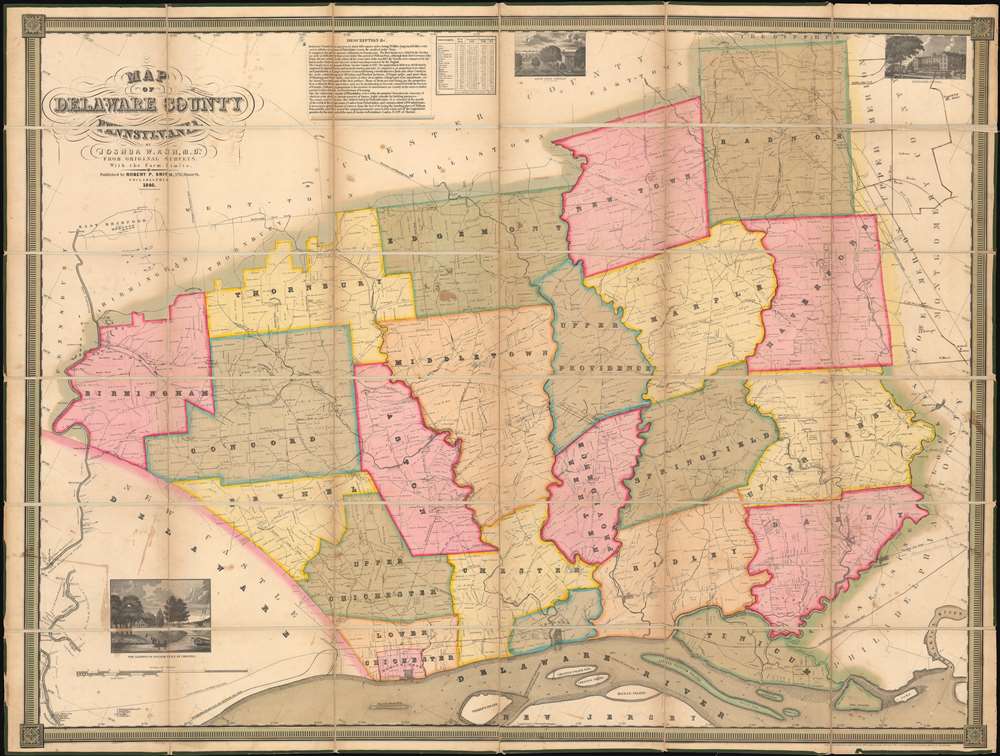
Map of Delaware County Pennsylvania.
sold
- Digital Map Information
- Suitable for large format printing
- Full resolution TIFF file
- ICC color profile embedded
- Delivered instantly via download link
One of only 4 known surviving examples of Joshua W. Ash's important 1848 map of Delaware, County Pennsylvania. Delaware county, located just southwest of Philadelphia, is one of Pennsylvania's oldest and most historic areas, the home of Swarthmore College, the Haverford School (Haverford Friends School), the Elwyn Institute, and numerous other institutions. It was here, at Chester, that William Penn first landed in 1682, founding the Quaker colony of Pennsylvania. At the time this map was made Chester was a region of rolling hills and gentlemanly estates - including the mapmaker Ash's own family properties. (more details)
Earliest known iternation of Colton's iconic Comparative Mountains and Rivers Chart.
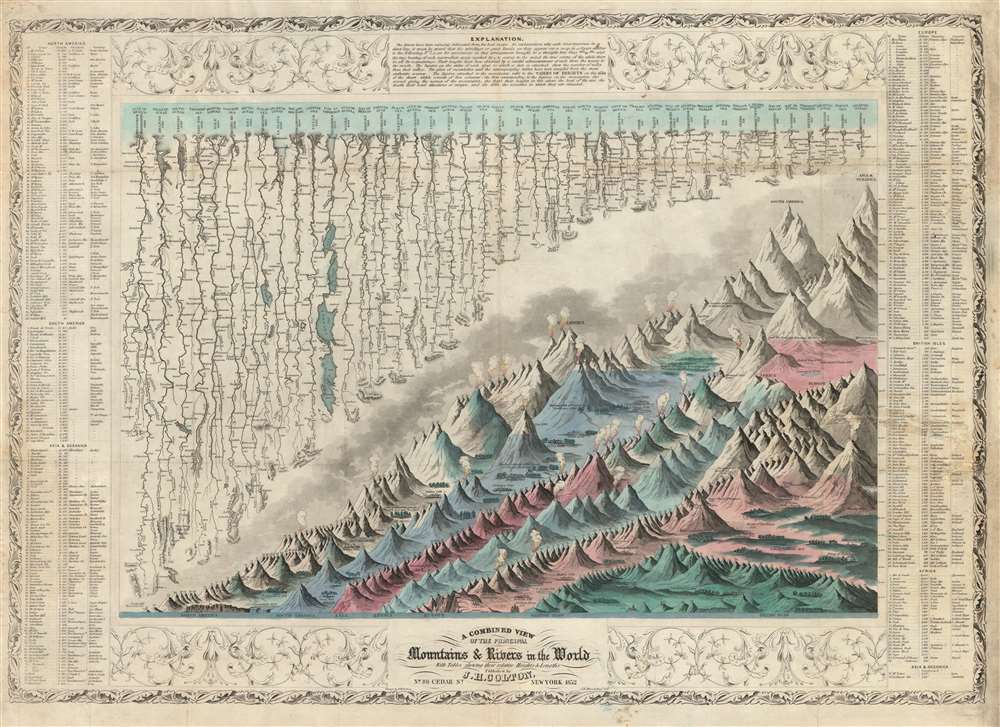
A Combined View of the Principal Mountains and Rivers in the World with Tables showing their relative Heights and Lengths.
sold
- Digital Map Information
- Suitable for large format printing
- DPI: 600
- File Size: 46.9 MB
- File Type: ZIP / TIFF
- ICC color profile embedded
- Delivered instantly via download link
The first 1852 separate-issue edition of Colton's Mountains and Rivers chart. This is the earliest known iteration of Colton's iconic comparative infographic chart illustrating relative sizes of great mountains and rivers. The chart was subsequently reduced in 1855 and reissued in multiple editions for Colton's popular n his 1855 Atlas of the World and later in in Johnson's 1860 New Family Atlas. The map is surrounded by decorative embellishments and several layers of border. To the right and left of the map there is a table identifying the individual mountains via a numerical cross reference system.
This is the finest American Mountains and Rivers chart of the mid-19th century. It depicts the relative distances of the world's great rivers and the relative heights of the world's great mountains. Included are a multitude of details regarding the heights of important cities, glaciers, volcanoes, and tree lines. Also shows Niagara Falls, the Great Pyramid, St. Peter's Basilica in Rome and St. Paul's in London. The chart notes curiosities that would have been relevant at the time, such as 'The Greatest Altitude of the Growth of Peruvian Bark', 'The Glacier of Maladetts', the 'Table Land of Pamar', and the 'Greatest Altitude attained by Humboldt 19400 ft'. Replete with additional geographical errors and misconceptions common to the period. (more details)
This is the finest American Mountains and Rivers chart of the mid-19th century. It depicts the relative distances of the world's great rivers and the relative heights of the world's great mountains. Included are a multitude of details regarding the heights of important cities, glaciers, volcanoes, and tree lines. Also shows Niagara Falls, the Great Pyramid, St. Peter's Basilica in Rome and St. Paul's in London. The chart notes curiosities that would have been relevant at the time, such as 'The Greatest Altitude of the Growth of Peruvian Bark', 'The Glacier of Maladetts', the 'Table Land of Pamar', and the 'Greatest Altitude attained by Humboldt 19400 ft'. Replete with additional geographical errors and misconceptions common to the period. (more details)
A monumental map of Havana, Cuba in the tradition of tourist maps created for European capitals.
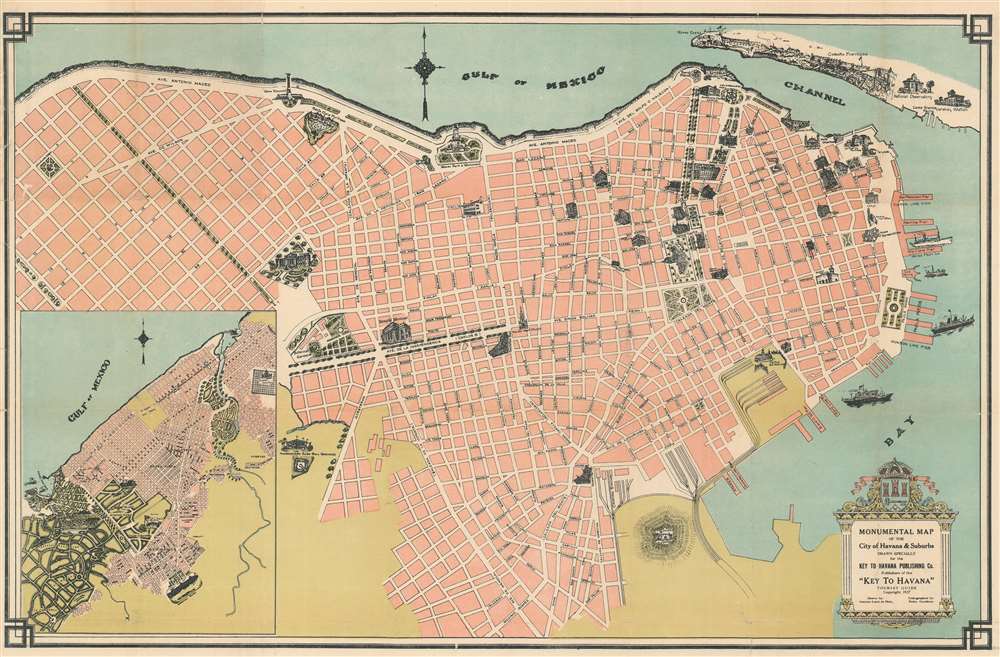
Monumental Map of the City of Havana and Suburbs. Drawn Specifically for the Key to Havana Publishing Co. Publishers of the 'Key to Havana' Tourist Guide.
sold
- Digital Map Information
- Suitable for large format printing
- File Size: 27.43 MB
- File Type: ZIP / TIFF
- ICC color profile embedded
- Delivered instantly via download link
This is a 1927 Antonio Loret de Mola pictorial map of Havana, Cuba. The map depicts the city from Villalón Park and the Avenida Paseo to Havana Harbor and from the La Cabaña Fortress and the Entrance Channel to the Castillo de Atarés. Beautifully illustrated, numerous sites around the city are illustrated in profile, including the several hotels, the Congress building, the House of Representatives, the National Library, the National University, and the national theatre. Monuments throughout the city are also shown, including the Maine Monument, which was erected in 1925 in remembrance of the victims of the USS Maine, and the monument to Antonio Maceo Grajales, the second-in-command of the Cuban Army of Independence. Special attention is paid to Havana's fortresses, such as the La Cabaña (Fortaleza de San Carlos de la Cabaña), the third largest fortress in the Americas, Morro Castle (Castillo de Los Tres Reyes del Morro), La Punta Fortress (Castillo San Salvador de la Punta), and the Atares Fortress (Castillo de Atarés). City parks, illustrated in green, are scattered all around the city. An inset map situated in the lower left corner, depicts from the Marianao Beach to the Columbus Cemetery and from the Gulf of Mexico to Oriental Park. (more details)
A charming city plan of Nassau in the Bahamas.
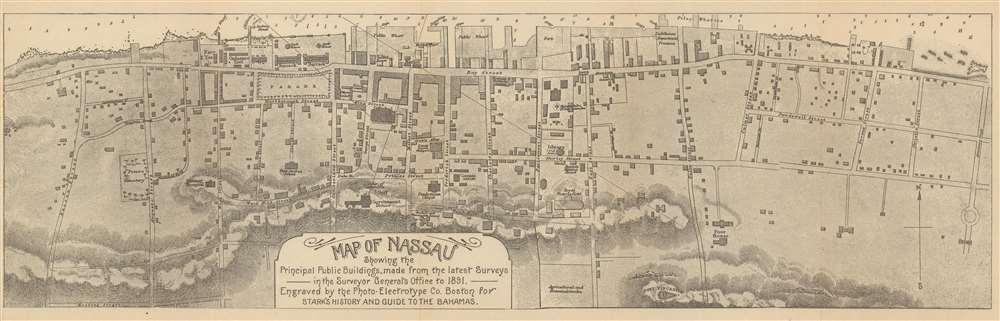
Map of Nassau Showing the Principal Public Buildings, made from the latest Surveys in the Surveyor General's Office to 1891.
sold
- Digital Map Information
- Suitable for large format printing
- File Size: 13.31 MB
- File Type: ZIP / TIFF
- ICC color profile embedded
- Delivered instantly via download link
This is an 1891 James Henry Stark city map or plan of Nassau, The Bahamas. The map depicts the city from Nassau Street to Armstrong Street and from the harbor to Fort Fincastle and Meeting Street. Highly detailed, myriad buildings throughout the city are illustrated, with two barracks, the ordnance yard, the navy yard, the cathedral, the library, and the Royal Victoria Hotel among those identified. Potter's Cemetery, the French consulate, the Government House, and the statue of Columbus are also noted. Every street is labeled, as is the parade ground. Depth soundings are noted in the harbor. (more details)
Illustrates the situation during the Mexican revolution a year before the American invasion at Veracruz.

Compliments of The Travelers Insurance Company, Hartford, Conn.
sold
- Digital Map Information
- Suitable for large format printing
- File Size: 27.5 MB
- File Type: ZIP / TIFF
- ICC color profile embedded
- Delivered instantly via download link
This is a 1913 Travelers Insurance Company and Rand McNally map of Mexico during the Mexican Revolution (1910 – 1920). The map, intended for American customers of Travelers, was meant to assure investors that their insured assets in Revolutionary Mexico were protected. Coverage extends from the Pacific Ocean to the Atlantic Ocean and from the southern United States to Guatemala, Honduras, and the Gulf of Tehuantepec. Created for the Travelers Insurance Company, the situation in Mexico is presented by using red overprinting identifying which factions controlled various parts of Mexico. Areas controlled by Venustiano Carranza, Jose 'Poncho' Villa, and Emiliano Zapata, all important figures in the Mexican revolution, are labeled, as are all the garrisons of Mexican federal troops. U.S. forts along the U.S.-Mexico border are also highlighted using the red overprinting, reinforcing the notion that the United States was protected against the chaos to its south. As this is a Rand McNally map, myriad cities, towns, and villages are labeled and the principle cities are underscored in red. An inset map of Mexico City and its environs is situated in the lower left corner. (more details)
Highlights a proposed development along Lake Pontchartrain and the extension of the City Park.
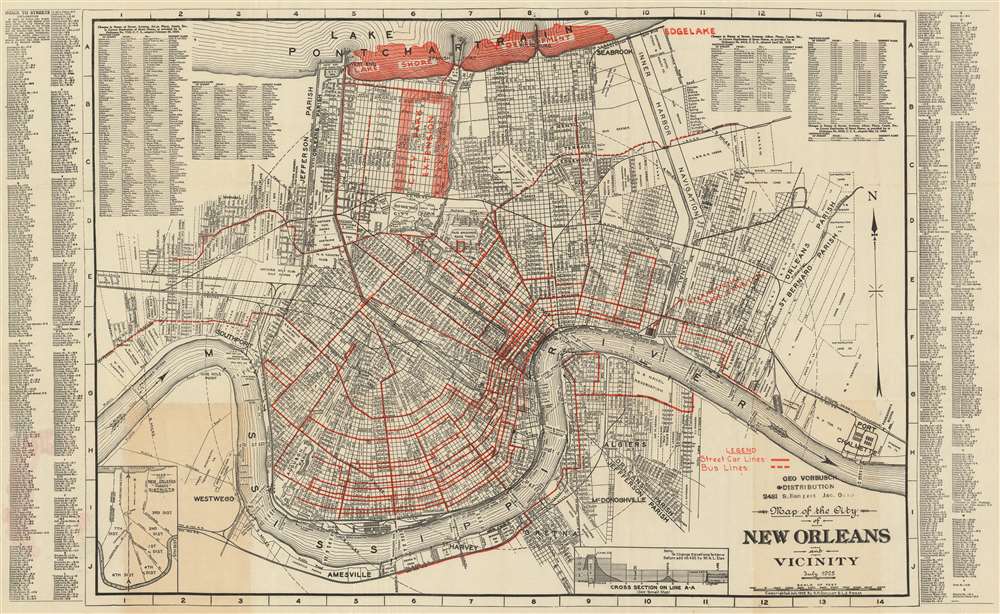
Map of the City of New Orleans and Vicinity. July 1925.
sold
- Digital Map Information
- Suitable for large format printing
- File Size: 64.31 MB
- File Type: ZIP / TIFF
- ICC color profile embedded
- Delivered instantly via download link
This is a 1929 A.H. Guillot and L.J. Adam city map or plan of New Orleans, Louisiana. The map depicts the city from Southport and Westwego to Port Chalmette and from Lake Pontchartrain to the Mississippi River and Amesville. Illustrating New Orleans in a high level of detail, myriad streets are depicted and labeled throughout the city. Numerous planned city improvements are highlighted in red, including a development along the banks of Lake Pontchartrain and an extension of the city park covering an area of approximately fourteen city blocks square from Florida Avenue to Robert E. Lee Boulevard and from Orleans Avenue to the Bayou St. John. Street car lines (solid lines) and bus lines (dashed lines) are illustrated by red overprinting, as is the International Trade Exhibition, which is located along the Mississippi River. Ferry routes across the Mississippi are also noted, as is the depth of the river. Concentric circles extend from the city center, marking one-mile intervals from the French Quarter. The limits of Orleans Parish, Jefferson Parish, and St. Bernard Parish are also illustrated. A street inded is present along both the right and left borders, as is an index of street names that had changed as of February 20, 1924. An inset map, situated in the lower left corner, depicts the districts of New Orleans. (more details)
Includes illustrations of The Sun, The Moon, Woden and Thor.

The Chief of the Saxon Idols are thus depicted from Verstegan to oblige ye Curious.
sold
- Digital Map Information
- Suitable for large format printing
- DPI: 600
- File Size: 13.09 MB
- File Type: ZIP / TIFF
- ICC color profile embedded
- Delivered instantly via download link
This is a c. 1700 James Basire engraving of the seven chief Anglo-Saxon gods, for whom the days of the week are named, per Richard Verstegan (aka Verstegen, aka Rowlands), and the Wicker Man, a Saxon ritual, from Britannnia by Aylett Sammes. The seven gods Verstegan proposes are first in the minds of the Saxons are The Sun, The Moon, Tuico, Woden, Thor, Friga, and Seater, for whom one of the seven days of the week is named. These seven illustrations are inspired by very similar ones present in Richard Verstegan's A Restitution of Decayed Intelligence in Antiquities. Concerning the Most Noble and Renovvmed English Nation, which was published in Antwerp in 1605. (more details)
An extremely rare early map of northern Vietnam most likely identifying Hanoi and Hue.

2me Carte du Tunquin.
sold
- Digital Map Information
- Suitable for large format printing
- DPI: 600
- File Size: 11.39 MB
- File Type: ZIP / TIFF
- ICC color profile embedded
- Delivered instantly via download link
This is an extremely rare c. 1810 Porlier map of northern Vietnam and southern China. The map depicts the region from Tchely (labeled as the 'Capitale du Pays dans le Yun-nan - most likely Kunming) to Hainan Island and from southern China to the city of Koue-hoe (Hué, Vietnam - the ancient capital of Cochinchina. Parts of Ha Long Bay, the Gulf of Tonkin, and Hainan Island are illustrated, as are the Red River delta and a fair portion of the interior of modern-day Vietnam. Several towns and villages identified, including Tong-tou, labeled as the 'Capitale du Tonquin' this is most likely the modern-day city of Hanoi. Several branches of the Red River are also labeled. (more details)
Illustrates the economic production of North America and Asia and identifies numerous industries.
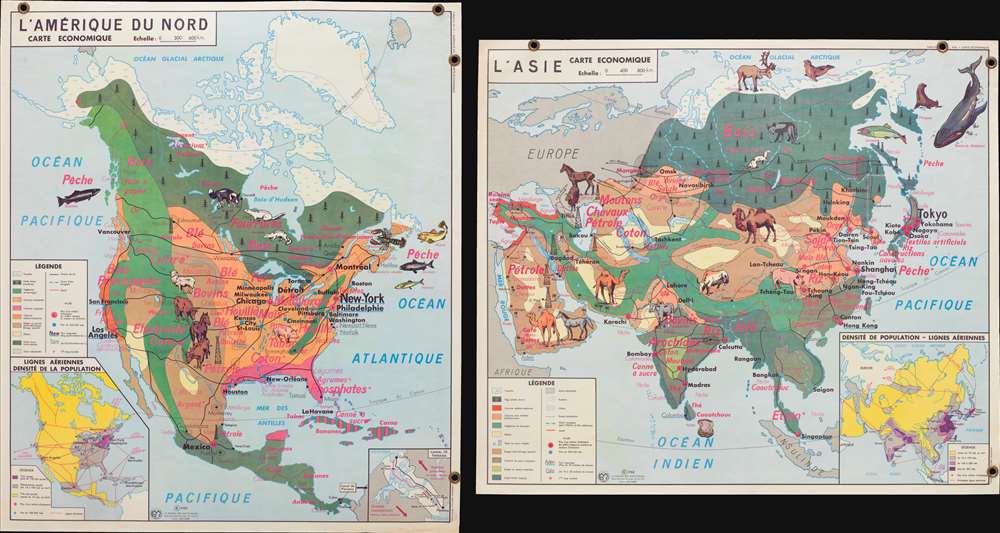
L'Amérique du Nord Carte Economique. / L'Asie Carte Economique.
$300.00
Acquire
- Digital Map Information
- Suitable for large format printing
- File Size: 5.47 MB
- File Type: ZIP / TIFF
- ICC color profile embedded
- Delivered instantly via download link
This is a 1960 Jean Anscombre double-sided pictorial map of the economic production of North America and Asia. The map depicts North America from the Pacific Ocean to the Atlantic Ocean and from the Arctic Ocean to northern South America and Asia from Europe and East Africa to the Pacific Ocean and from the Arctic Ocean to the Indian Ocean and Indonesia. Strikingly colored and illustrated, both maps use pinkish-red text to identify the various products created or raised in regional areas of each continent. Different sizes of font are used, along with varying degrees of a bold typeface, to emphasize the relative importance of certain products.
In North America, wheat (blé), cows, (bovins), and wood (bois) are produced in numerous different parts of the continent, whereas cotton (coton) and phosphates (phosphates) are focused in certain regions. Illustrations of livestock. Including cows, a horse, sheep, a pig, and several species of fish emphasize these industries. City names and highways are also included, as are inset maps illustrating air routes and population density and the Panama Canal Zone are situated along the bottom border.
The Asia map employs the same general concepts and aesthetic, with rice (riz), cotton (coton), tea (thé), sheep (moutons), and oil (pétrole) among the most common products. Illustrations of horses, camels, yak, and salmon highlight the livestock and other animals raised and caught in Asia. Cities throughout the region, including Tokyo, Yokohama, Beigina, Shanghai, Mumbai (Bombay) Karachi, Tehran, and Baghdad are identified. Just as on the North America map, an inset illustrating population density and air routes is situated in the lower right corner. (more details)
In North America, wheat (blé), cows, (bovins), and wood (bois) are produced in numerous different parts of the continent, whereas cotton (coton) and phosphates (phosphates) are focused in certain regions. Illustrations of livestock. Including cows, a horse, sheep, a pig, and several species of fish emphasize these industries. City names and highways are also included, as are inset maps illustrating air routes and population density and the Panama Canal Zone are situated along the bottom border.
The Asia map employs the same general concepts and aesthetic, with rice (riz), cotton (coton), tea (thé), sheep (moutons), and oil (pétrole) among the most common products. Illustrations of horses, camels, yak, and salmon highlight the livestock and other animals raised and caught in Asia. Cities throughout the region, including Tokyo, Yokohama, Beigina, Shanghai, Mumbai (Bombay) Karachi, Tehran, and Baghdad are identified. Just as on the North America map, an inset illustrating population density and air routes is situated in the lower right corner. (more details)
One of the earliest maps to depict the Idaho Territory.
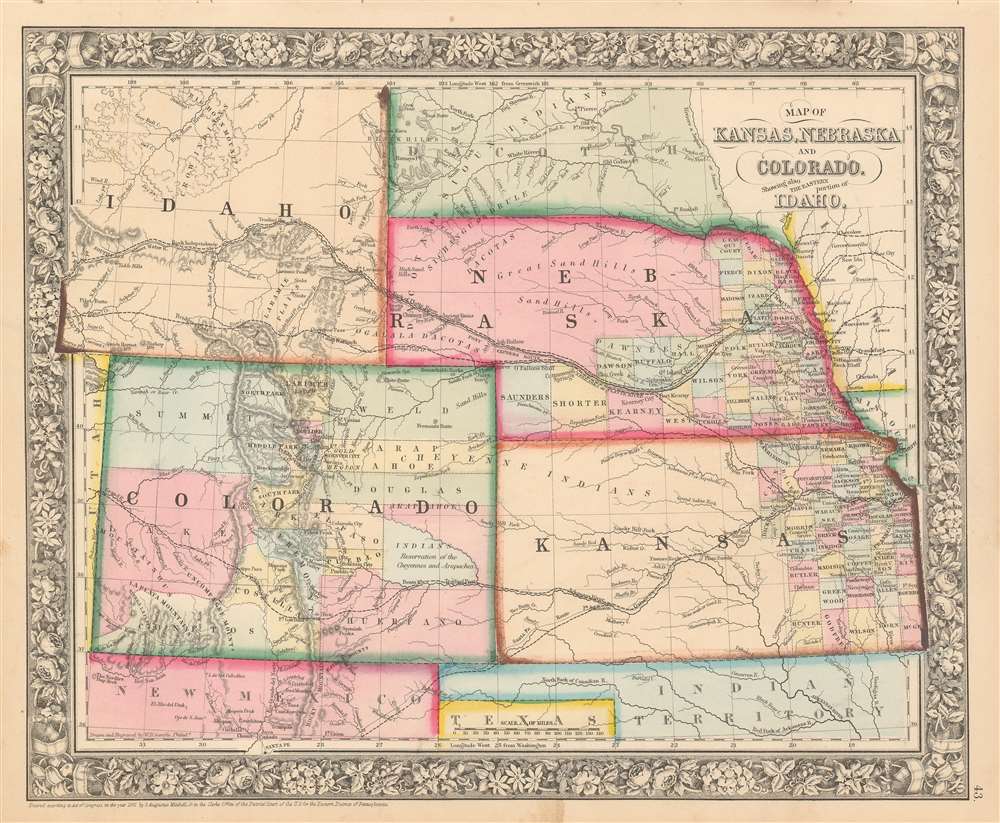
Map of Kansas, Nebraska and Colorado, Showing also the Eastern Portion of Idaho.
sold
- Digital Map Information
- Suitable for large format printing
- File Size: 12.57 MB
- File Type: ZIP / TIFF
- ICC color profile embedded
- Delivered instantly via download link
A very ephemeral and surprisingly scarce 1863 Samuel Augustus Mitchell, Jr. map of Colorado, Nebraska, Kansas, and that part of Idaho Territory which is today Wyoming. The map depicts the region from the Utah-Colorado border to Iowa and Missouri and from the Big Horn Mountains to northern Texas and Santa Fe, New Mexico. This map holds the distinction of being one of the few to include Wyoming as Idaho Territory, which was formed in March 1863. The iteration of Wyoming/Idaho as seen here is exceptionally ephemeral and present only in this edition (1863), with subsequent editions (1864 - 1868) attaching Wyoming to Dakota (See below). Apart from this rare iteration of Idaho Territory / Wyoming, other intriguing aspects of this map include the fact that only about one half of Nebraska and the eastern third of Kansas are illustrated as having been divided into counties, while Colorado only has fifteen counties that vary wildly in relative size. Myriad towns and villages are labeled, along with the Pony Express route and proposed routes for the transcontinental railroad. (more details)
One of the most attractive American atlas maps of Washington D.C. to appear in the mid-19th century.

Plan of the City of Washington, The Capitol of the United States of America.
sold
- Digital Map Information
- Suitable for large format printing
- File Size: 11.85 MB
- File Type: ZIP / TIFF
- ICC color profile embedded
- Delivered instantly via download link
This is an 1861 S.A. Mitchell, Jr. city map or plan of Washington, D.C. The map depicts the city from Georgetown to the Anacostia River (Eastern Branch) and from Boundary Street to Greenleafs Point and the confluence of the Anacostia and Potomac Rivers. Highly ... (more details)
Illustrates the 'liberated zones' of South Vietnam and was published by the Viet Cong in Cuba.

Zonas Liberadas en Viet-Nam del Sur.
sold
- Digital Map Information
- Suitable for large format printing
- File Size: 17.45 MB
- File Type: ZIP / TIFF
- ICC color profile embedded
- Delivered instantly via download link
A map of the utmost rarity and sheer revolutionary coolness. This is a 1968 map of Vietnam published in Havana, Cuba, by the Misión Permanente del Frente Nacional de Liberación de Viet Nam del Sur en la Républica de Cuba (Permanent Mission of the National Liberation Front of South Viet Nam in the Republic of Cuba), essentially the Việt Cộng mission to Cuba. In June of 1968, following the Tet Offensive, the mission published Viet-Nam del Sur Vencera a Spanish language newspaper highlighting the achievements of the Việt Cộng against American and other 'capitalist' forces - this map is the centerfold, although the entire newspaper is included in this offering. A remarkable example of pro-Việt Cộng propaganda, the broadsheet consists of three different maps of South Vietnam highlighting the North Vietnamese conquest of South Vietnam between 1961 and 1968. The largest map, situated on the right, depicts the gains of the Việt Cộng in South Vietnam following the Tet Offensive, one of the largest military campaigns of the Vietnam War. The area shaded red on all three maps highlights the 'Liberated Zones' controlled by the Việt Cộng. Imporant cities and towns are labeled throughout South Vietnam, including Saigon, Da Nang, and Hue. (more details)
A Hebrew map of Israel published shortly after the Six-Day War.

Eretz Israel. / .ארץ - ישראל
sold
- Digital Map Information
- Suitable for large format printing
- File Size: 26.33 MB
- File Type: ZIP / TIFF
- ICC color profile embedded
- Delivered instantly via download link
This is a c. 1968 Michael Avi-Yonah map of Israel in Hebrew. The map depicts the region from the Mediterranean Sea to Jordan and Syria and from Lebanon to Gaza. Although undated, the presence of two different borders, and the language used in the key, allows us to deduce that this map must postdate the 1967 Six-Day War when Israel occupied the West Bank and Gaza Strip. A dashed border is used to illustrate Israel's 1947 borders, while dotted lines mark the areas 'held' by Israel after the Six-Day War.
Myriad locations throughout the region are labeled, including Tel Aviv and Jerusalem. A distinction is even made between a Hebrew village (a circle with a dot at its center) and an Arab village (a circle without a dot). Roads, railroads, and water pipes are also illustrated. Mountains and rivers are also shown, as is the Dead Sea. (more details)
Myriad locations throughout the region are labeled, including Tel Aviv and Jerusalem. A distinction is even made between a Hebrew village (a circle with a dot at its center) and an Arab village (a circle without a dot). Roads, railroads, and water pipes are also illustrated. Mountains and rivers are also shown, as is the Dead Sea. (more details)
Highlights the fighting in the West Bank, Golan Heights, and on the Sinai Peninsula.
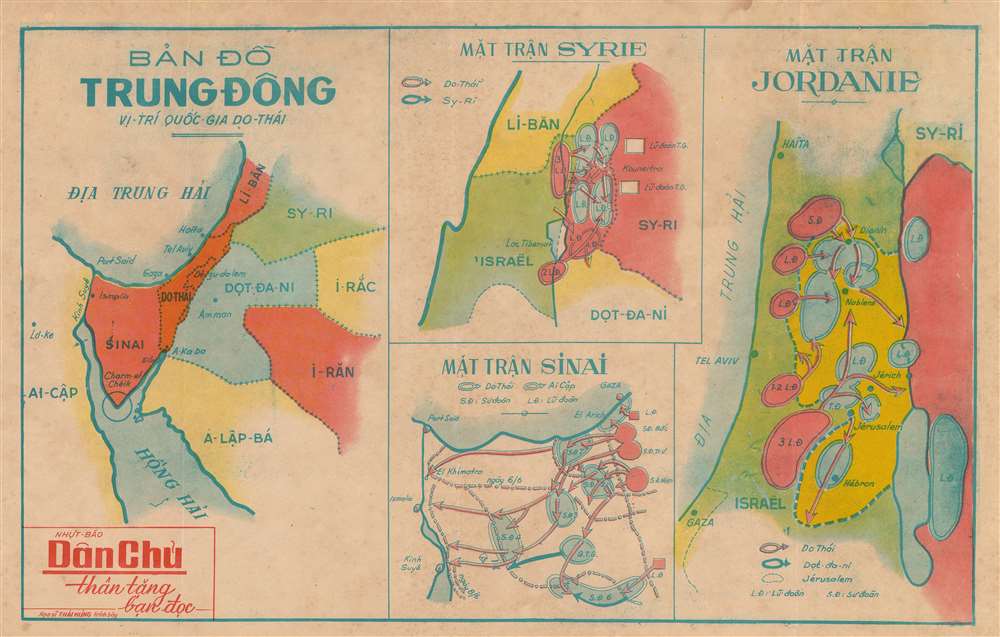
Bản đồ Trung đông Vị -Trí quốc gia do thái. / (Map of the Middle East - The Position of the Jewish State).
sold
- Digital Map Information
- Suitable for large format printing
- File Size: 14.29 MB
- File Type: ZIP / TIFF
- ICC color profile embedded
- Delivered instantly via download link
This is a c. 1967 Thai Hung and Dan Chu newspaper map of the Middle East during the Six-Day War. A composition consisting of four maps on one sheet, a general map of the Middle East is situated on the left, providing the newspaper's readers with the geographical context they need to be able to comprehend the events unfolding in the war. This map illustrates the region from the Mediterranean Sea and Egypt to Iraq and Saudi Arabia and from Lebanon and Syria to the Red Sea. Major cities in Israel (labeled here as Jewish - Do-Thái), such as Haifa, and Tel Aviv are labeled, as is Jerusalem, which at the time was split between Jordan and Israel. Amman, the capital of Jordan, is also labeled, along with Gaza. A handful of other locations are also noted. (more details)
A city plan of Tel Aviv printed in Hebrew one year after the creation of the state of Israel.
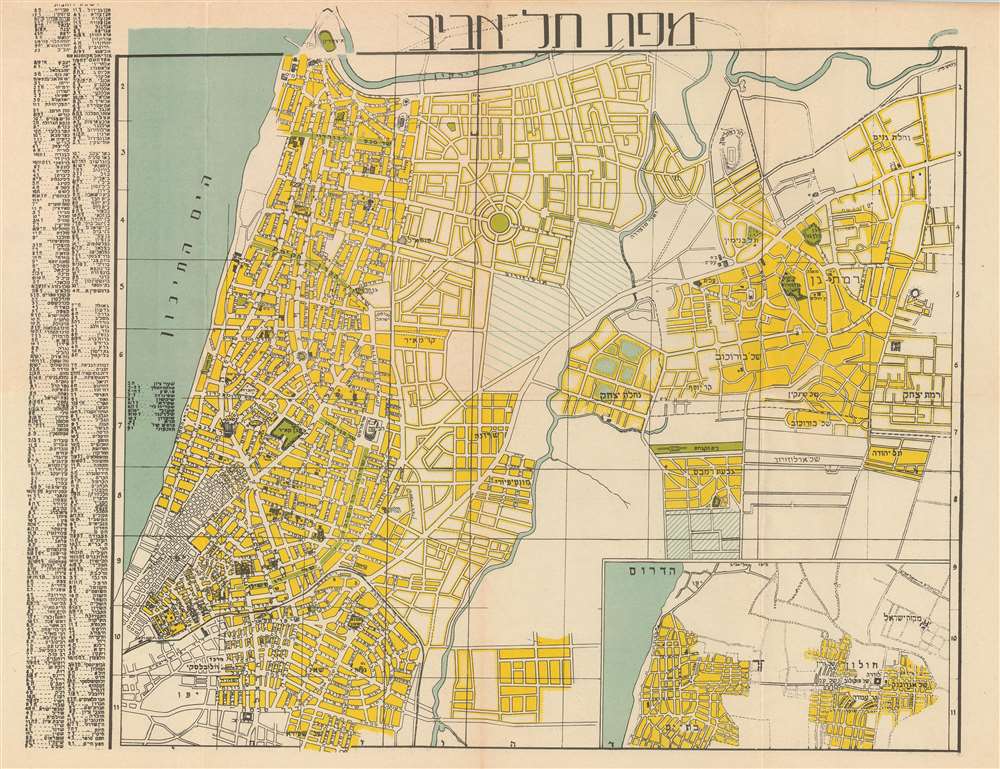
Map of Tel-Aviv. / מפת תל אביב.
sold
- Digital Map Information
- Suitable for large format printing
- File Size: 13.68 MB
- File Type: ZIP / TIFF
- ICC color profile embedded
- Delivered instantly via download link
This is a 1949 H. Goldschmidt city map or plan of Tel Aviv, Israel in Hebrew. The map depicts the city from the Yarkon River south to Jaffa and from the Mediterranean Sea to Ramat Gan. Highly detailed, myriad streets are illustrated and labeled throughout the ... (more details)
A comical and incredibly detailed pictorial map of Frankfurt, Germany created by a U.S. Army master sergeant.
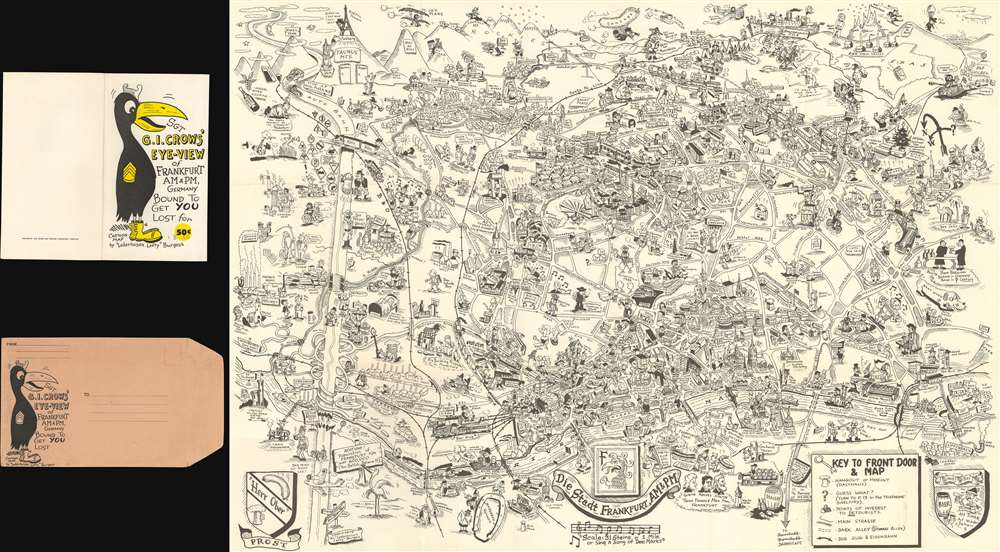
Sgt. G.I. Crows' Eye View of Frankfurt AM and PM, Germany. Bound to Get You Lost for 50 cents.
sold
- Digital Map Information
- Suitable for large format printing
- Full resolution TIFF file
- ICC color profile embedded
- Delivered instantly via download link
This is a 1954 Byrel 'Lefty' Burgess humorous pictorial map of Frankfurt, Germany, published by Stars and Stripes in Darmstadt, Germany. The map depicts the city from the Höchst district of Frankfurt to the town of Bad Vilbel and from the Harheim district of Frankfurt to Offenbach. Myriad locations throughout Frankfurt are illustrated, with special attention paid to those associated with the American military presence in the city. Several barracks are noted throughout the city, as is the 97th Hospital and the quarters of the WACs (Women's Army Corps). The American school (referred to by its students simply as Frankfurt High) is also labeled, as is the area where dependents lived, as is the PX (Post Exchange). Numerous districts within Frankfurt are also identified, including Heddernheim, Bonames, Eschersheim, and Seckbach. G.I.s are present all over the city. Going about their lives and official army business, but also carousing with women, in beer halls, and simply wandering the city. Military Police are also shown, perhaps in an attempt to help remind the soldiers that there is a need for decorum.
Streets throughout the city are labeled, some of which are marked by comical vignettes, such as a devil next to Dante Strasse saying 'He wrote about me!' or Beethoven Platz and Mendelssohn Strasse, which are accompanied by caricatures of the famous composers. Historic sites are also illustrated, labeled, and usually dated, such as the Dom which dates to the 13th century and, as Burgess notes, is 300 feet high. The Saalhof, the Karmeliter Kloster, and the Dominikaner Kloster are also labeled. Other sites, such as the Drei Königs Kirche, are highlighted by comical vignettes. As are certain historical facts, like the 'Roman Tourist' from 900 or the spa in Bad Homburg where, apparently, 'Wilhelm II bathed'. Perhaps the most pervasive reference, though, is to beer 'bier', a German cultural treasure. References to locations around the United States are situated along the map's top border, including Pike's Peak in Colorado and the Rocky Mountains as a whole, Texas, the 'Los Angeles City Limit', and Chicago is shown in the upper right corner. (more details)
Streets throughout the city are labeled, some of which are marked by comical vignettes, such as a devil next to Dante Strasse saying 'He wrote about me!' or Beethoven Platz and Mendelssohn Strasse, which are accompanied by caricatures of the famous composers. Historic sites are also illustrated, labeled, and usually dated, such as the Dom which dates to the 13th century and, as Burgess notes, is 300 feet high. The Saalhof, the Karmeliter Kloster, and the Dominikaner Kloster are also labeled. Other sites, such as the Drei Königs Kirche, are highlighted by comical vignettes. As are certain historical facts, like the 'Roman Tourist' from 900 or the spa in Bad Homburg where, apparently, 'Wilhelm II bathed'. Perhaps the most pervasive reference, though, is to beer 'bier', a German cultural treasure. References to locations around the United States are situated along the map's top border, including Pike's Peak in Colorado and the Rocky Mountains as a whole, Texas, the 'Los Angeles City Limit', and Chicago is shown in the upper right corner. (more details)
An extremely rare railroad map of the route between Brooklyn and Boston.

Long Island and Eastern States Line.
sold
- Digital Map Information
- Suitable for large format printing
- File Size: 15.4 MB
- File Type: ZIP / TIFF
- ICC color profile embedded
- Delivered instantly via download link
This is an 1891 American Bank Note Company railroad map of Long Island. The map illustrates railroad connections between Brooklyn, Long Island City, and Boston, along with all the points in between and depicts the region from New Jersey to Boston and from Albany to Staten Island. The railroads are highlighted in red and trace the way from Brooklyn to Boston. The steamer 'Cape Charles' is used for the transfer across Long Island Sound. Trains left Boston and Brooklyn at approximately 11 p.m. nightly and arrived at their respective destinations by 7:30 a.m. the following morning. The map also highlights the entire Long Island Railroad, which extends the length of Long Island from Brooklyn and Long Island City to Greenport and Sag Harbor. Cities and towns throughout the region are labeled, particularly along the rail lines, including Hartford, New Haven, and Providence. Myriad points, necks, bays, and other coastal features are also identified. (more details)
An early map of Florida just before the Second Seminole War.
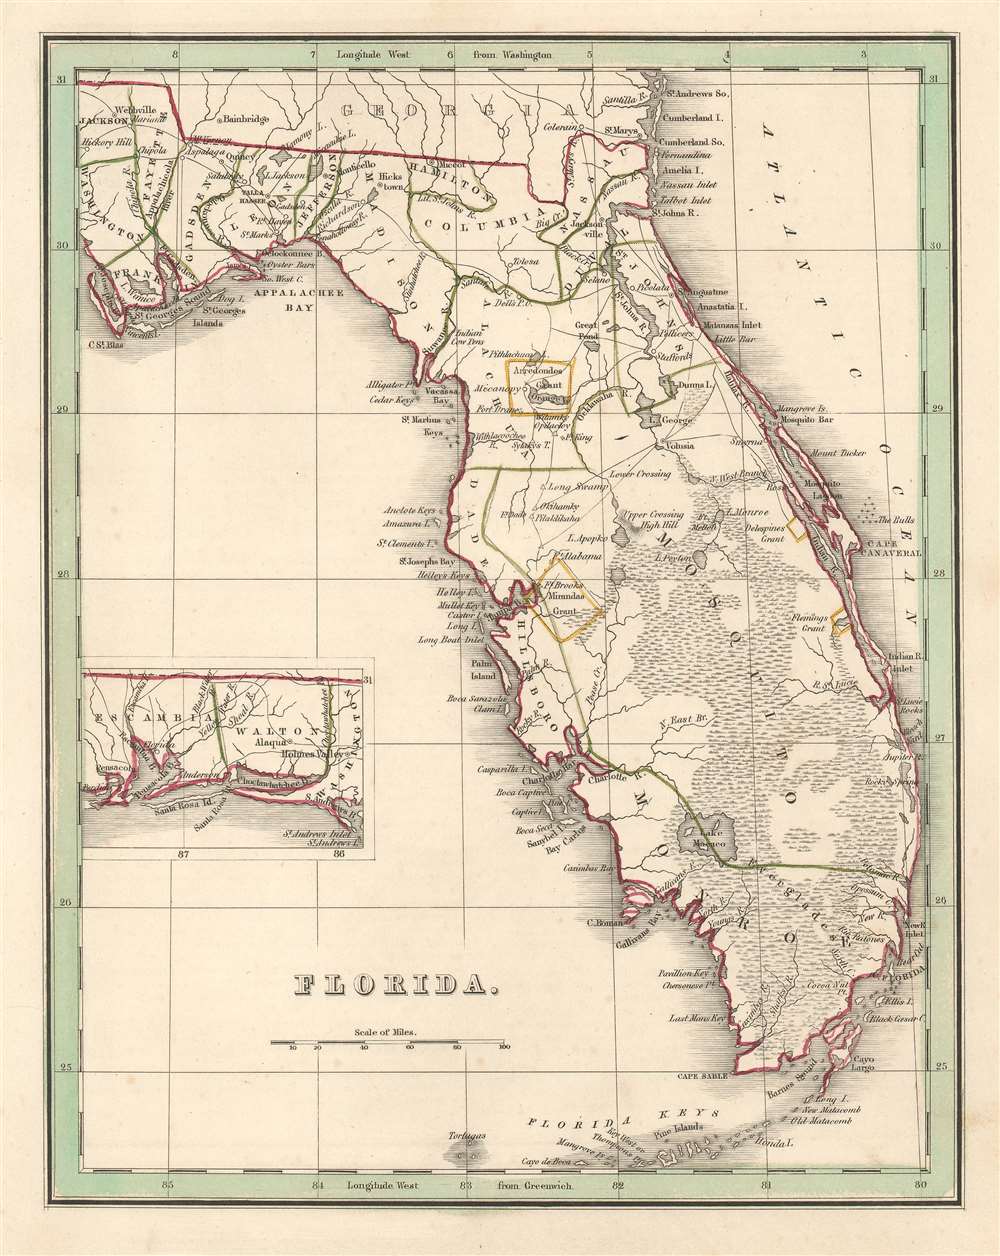
Florida.
sold
- Digital Map Information
- Suitable for large format printing
- DPI: 600
- File Size: 5.39 MB
- File Type: ZIP / TIFF
- ICC color profile embedded
- Delivered instantly via download link
This is a scarce 1835 T. G. Bradford map of Florida. The map depicts Florida as it appeared at the outset of the Second Seminole War (1835 - 1842) from Georgia to the Florida Keys and from St. Joseph's Bay to the Atlantic Ocean, with an inset map situated along the left border illustrating western Florida from Perdido Bay to St. Andrews Bay. An early Florida county structure is presented with Mosquito County occupying most of eastern Florida. Cities and towns throughout Florida are labeled, including Jacksonville and Tallahassee, while forts and Indian villages are identified in Central and Southern Florida. (more details)
An early comparative mountains chart originally commissioned by Alexander von Humboldt.

Physical Geography.
sold
- Digital Map Information
- Suitable for large format printing
- DPI: 600
- File Size: 13.69 MB
- File Type: ZIP / TIFF
- ICC color profile embedded
- Delivered instantly via download link
This is Adam and Charles Black's rare 1844 profile view of the Andes Mountains, particularly Ecuador's Mt. Chimborazo, based upon an influential 1805 illustration by the renowned German explorer and scientist Alexander von Humboldt. Among the first ... (more details)
A rare map of Dade County, Florida that includes Miami.
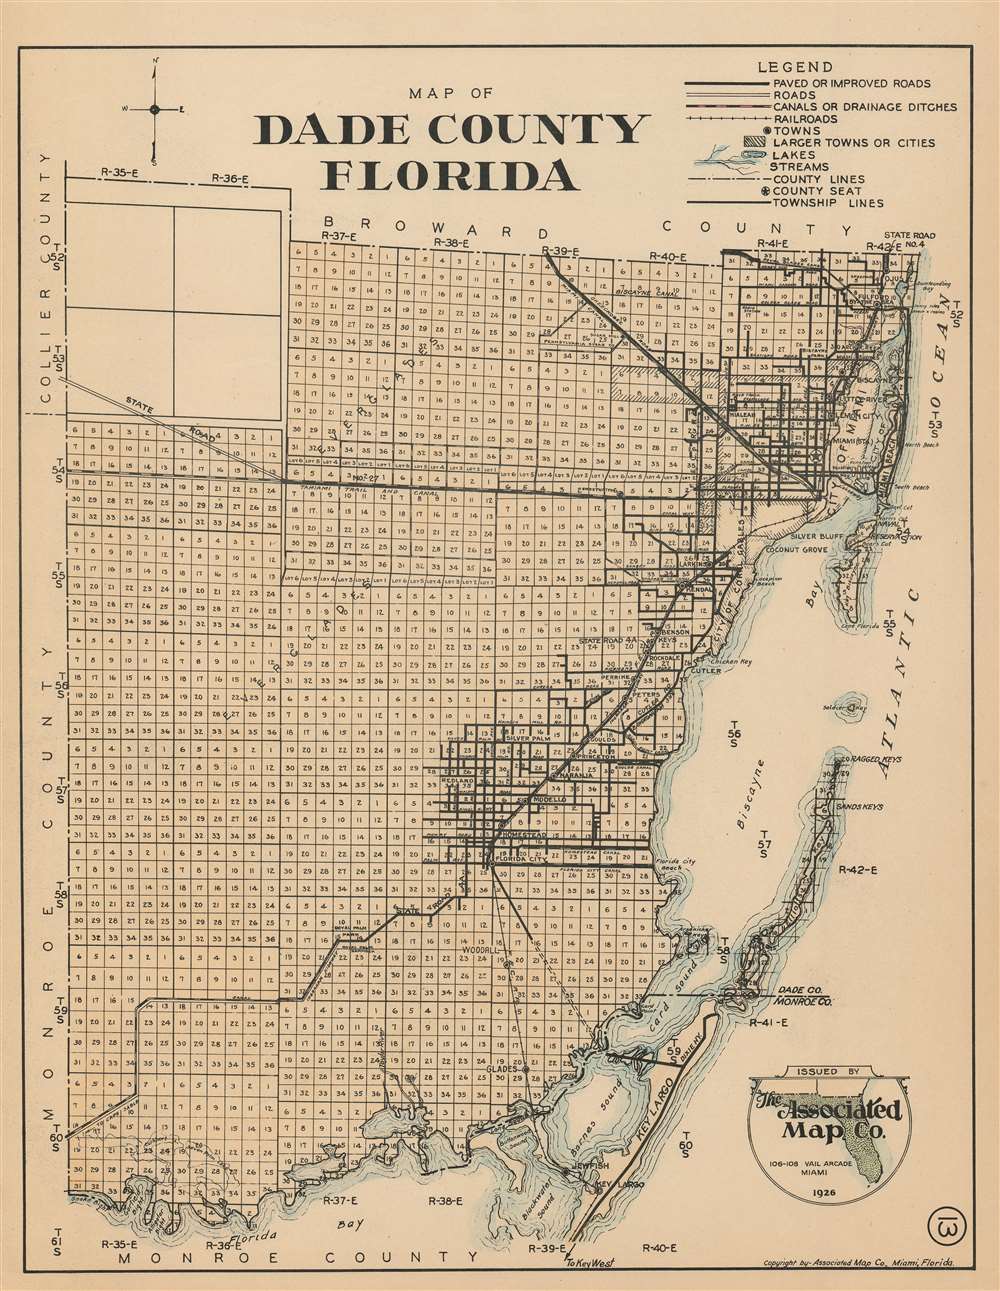
Map of Dade County Florida
sold
- Digital Map Information
- Suitable for large format printing
- File Size: 22.38 MB
- File Type: ZIP / TIFF
- ICC color profile embedded
- Delivered instantly via download link
This is a 1926 Associated Map Company map of Dade County, Florida. The map depicts the region from Monroe County and Collier County to the Atlantic Ocean and from Broward County to Monroe County and Florida Bay. Highly detailed, the entire county is divided into townships with every section in each township numbered. Miami is situated in the upper right corner, with numerous streets illustrated and labeled, along with Miami Beach and Key Biscayne. The Okeechobee Road and the Miami Canal are also labeled, as are the Royal Glades Canal and the Miami Trail and Canal. Towns south of Miami along the coast are also identified, including Homestead, Modello, and Florida City. Landmarks along the coast, such as keys, bays, sounds, and beaches are noted. (more details)