
The most complete illustration of Kircher's revolutionary hydro-geographic theories.

Systema Ideale Qvo Exprimitur, Aquarum per Canales hydragogos subterraneos ex mari et in montium hydrophylacia protrusio, aquarumq. subterrestrium per pyragogos canales concoctus.
sold
- Digital Map Information
- Suitable for large format printing
- DPI: 600
- File Size: 26.53 MB
- File Type: ZIP / TIFF
- ICC color profile embedded
- Delivered instantly via download link
This is one of the 17th century polymath Athanasius Kircher's most iconic and graphically intense maps. Situated amidst dense clouds with Aeolus, or wind heads, at the corners, the Earth appears as a gigantic fiery orb. Around the perimeter, we can recognize the oceans, mountains, land, whirlpools, and even a few sailing ships. The center of the Earth is a great fire. Beyond the flaming core, artery-like networks of subterranean seas and rivers connect great reservoirs hidden under mighty mountains. (more details)
The Italian polymath Kircher's iconic map of the Earth's Volcanic Systems.

Systema Ideale Pyrophylaciorum Suberraneorum, quorum montes Vulcanii, veluti spiracula quaedam existant.
sold
- Digital Map Information
- Suitable for large format printing
- DPI: 600
- File Size: 31.49 MB
- File Type: ZIP / TIFF
- ICC color profile embedded
- Delivered instantly via download link
This is one of the 17th century polymath Athanasius Kircher's most iconic and graphically intense maps. The map illustrates the interior of the Earth postulates cohesive global volcanic system tied to a fiery core. Situated amidst dense clouds with Aeolus, or wind heads, at the corners, the Earth appears as a gigantic fiery orb. Along the circumference, we can recognize the oceans, mountains, land, and even a few sailing ships. The center of the Earth is a great fire. Beyond the flaming core, artery-like networks of subterranean channels direct the heat of the core to volcanoes on the Earth's surface. (more details)
One of the first separately issued pictorial maps published in the United States.
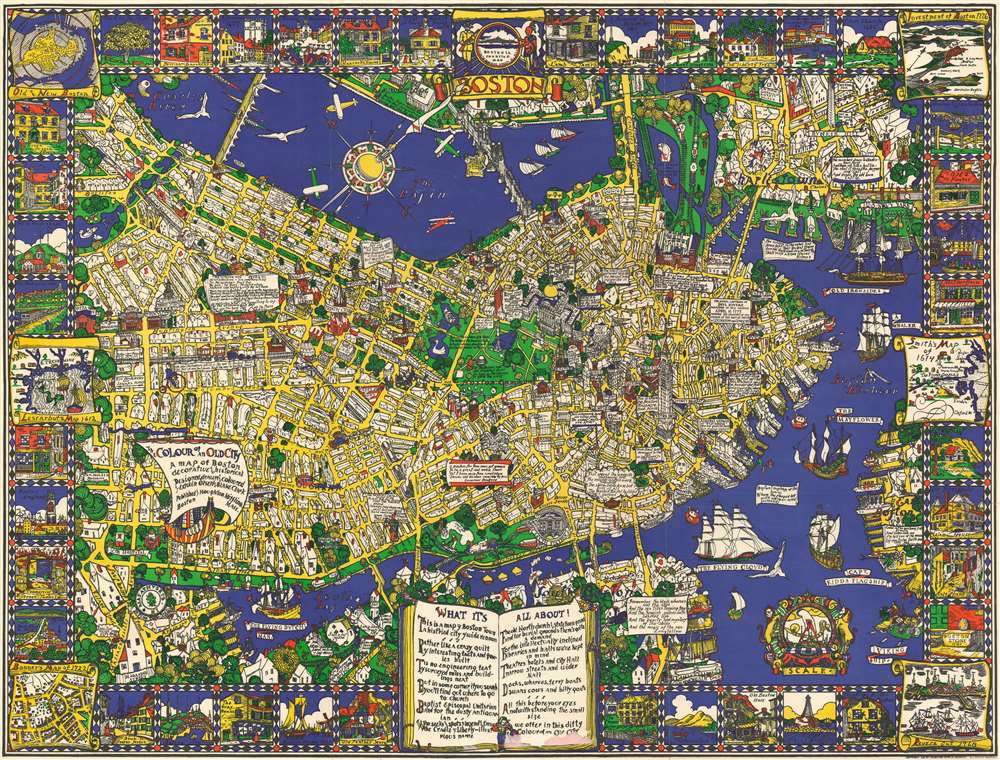
The Colour of an Old City A Map of Boston decorative and historical.
sold
- Digital Map Information
- Suitable for large format printing
- File Size: 96.22 MB
- File Type: ZIP / TIFF
- ICC color profile embedded
- Delivered instantly via download link
One of the first separately issued pictorial maps published in the United States, this is Edwin Birger Olsen and Blake Everett Clark's 1926 pictorial map of Boston. Centered on historic downtown Boston, the map depicts the city from Boylston Street to East Boston and from Cambridge to South Boston. Stunningly illustrated, Olsen and Clark blend together all the aspects that have come to be associated with pictorial cartography. Numerous sites throughout the city are drawn in profile, including the State House, the Custom House, North Station, Trinity Church, and Old North Church. Myriad streets are labeled, as are Boston Common and the Fens. Trains are busily steaming into and out of the city, while vintage sailing ships, such as the Mayflower, Captain Kidd's flagship, and the Flying Dutchman ply the waters of Boston Harbor. Airplanes, fairly modern invention that would change life in the 20th century, fly through the air over the Basin and the Charles River. The border consists of vignettes of historical sites and events around the city, including the Boston Tea Party during the American Revolution and a view of Tremont Street in 1798. Six historic maps of Boston are also reimagined along both sides. (more details)
A 19th century map of the Lenox Hill neighborhood in Manhattan that traces the neighborhood's development.
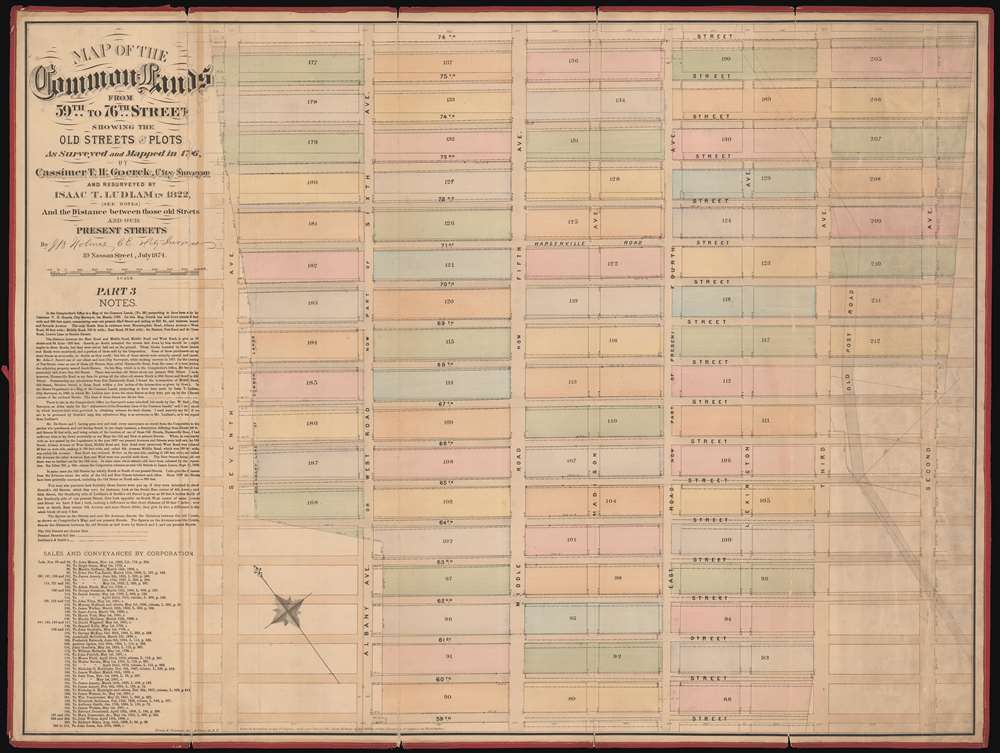
Map of the Common Lands from 59th to 76th Street Showing the Old Streets and Plots as Surveyed and Mapped in 1796 by Cassimer T.H. Goerck, City Surveyor, and Resurveyed by Isaac T. Ludlam in 1822 and the Distance between those old Streets and our Present Streets.
sold
- Digital Map Information
- Suitable for large format printing
- File Size: 42.53 MB
- File Type: ZIP / TIFF
- ICC color profile embedded
- Delivered instantly via download link
This is a John Bute Holmes 1874 cadastral map of the Lenox Hill neighborhood of Manhattan. The map depicts the neighborhood from Seventh Avenue (or at least where it would be if Central Park hadn't been built) to Second Avenue and from 76th Street to 59th Street and the vast majority of the map is occupied by the Common Lands. A somewhat-confusing jumble of solid and dashed lines appears throughout the neighborhood, allowing the viewer to trace its development, particularly with regard to its streets. Entire blocks were shifted between 1796, when Goerck first surveyed this part of Manhattan, and 1874, when Holmes created this work. Street angles changed, as did the width of both the streets and the avenues. At some point after Goerck's initial survey, both Madison Avenue and Lexington Avenue were cut down the middle of the blocks between Fourth Avenue and Fifth Avenue, and Fourth and Third Avenue, respectively, evident by how Holmes identifies each block by only one number and not two. (more details)
North America between the French and Indian War and the American Revolution.

North America, Drawn and Engraved from the best Maps and Charts.
sold
- Digital Map Information
- Suitable for large format printing
- DPI: 600
- File Size: 13.35 MB
- File Type: ZIP / TIFF
- ICC color profile embedded
- Delivered instantly via download link
This is a c. 1770 Thomas Kitchin map of North America issued after the French and Indian War but before the American Revolution. Depicting the continent from the Atlantic to Pacific and from Baffin's Bay to Mexico, Kitchin's map provides an overview (although slightly flawed) of the state of affairs on the North American continent at the pivotal point in world history. (more details)
A bird's-eye-view of electric and steam railroads in turn of the century New England.

Trolley Wayfinder Birds Eye View of Trolley Routes in New England.
sold
- Digital Map Information
- Suitable for large format printing
- File Size: 31.41 MB
- File Type: ZIP / TIFF
- ICC color profile embedded
- Delivered instantly via download link
A scarce and stunning bird's eye view style pocket map of New England issued in 1905 by George Walker published by the New England Street Railway Club. The view reveals New England, centered on Boston, extending north as far as Lewistown, Brunswick and Yarmouth; south to Narragansett Bay, Newport and New Bedford; and west as far as Worcester. Train and trolley routes throughout the region are illustrated, with myriad towns and villages labeled throughout the region. Both electric railroads and steam railroads are noted here, with red lines indicating an electric railroad and a black line marking the route of a steam railroad. Various parks, lighthouses, historic sites, and geographical features are also labeled. Popular routes are highlighted by inset maps, which include: Springfield-Turners Falls, Worcester-Springfield, Springfield-New York City, Pittsfield and Vicinity, Rochester-Nashua, Portsmouth-Lewiston, and a triangle route from Worchester to Providence to New London and back. An inset of the vicinity of Boston is situated in the upper left corner. (more details)
The first edition of Esso's extremely popular 'upside-down' road map - created for 'snowbirds' fleeing New York City in the winter.
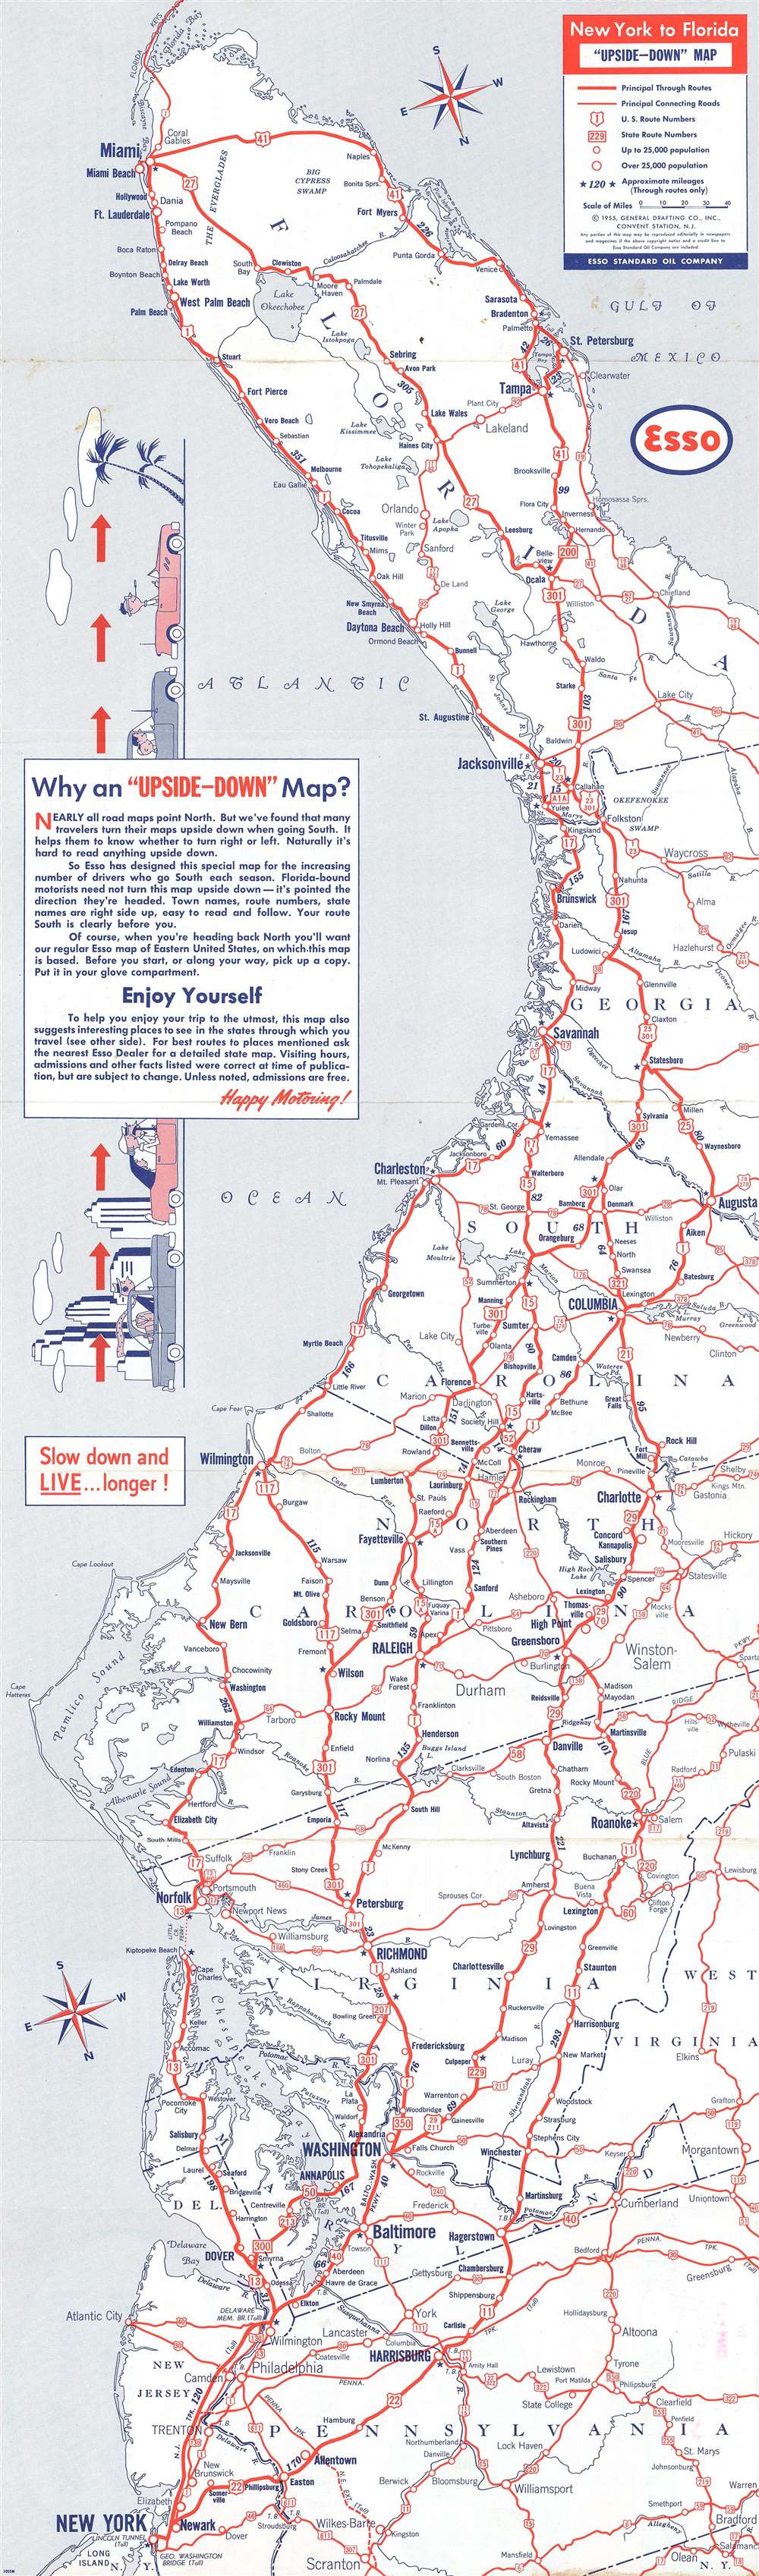
New York to Florida 'Upside-Down' Map.
sold
- Digital Map Information
- Suitable for large format printing
- File Size: 18.4 MB
- File Type: ZIP / TIFF
- ICC color profile embedded
- Delivered instantly via download link
A map with an unusual concept, this 1955 General Drafting Corporation road map of the east coast of the United States is printed upside-down! Created for 'snowbirds' fleeing New York City for the winter, this map is unlike nearly every other map one encounters. General Drafting discovered that travelers would turn their maps upside-down when traveling south, so it was decided that a map should be created that would accommodate this habit. Normally, maps are printed with the northernmost point depicted on the map at the top. Here, the cartographers have done the exact opposite: they created the map with Florida, more specifically the Florida Keys, at the top of the map and New York City at the bottom. As jarring as this may be at first glance, the more one looks at this piece the more charm it exudes. The entire piece was done purposefully. All text is printed correctly (not upside-down like the map's geography), making it fully functional. Major metropolises, such as New York, Washington, D.C., Baltimore, Richmond, Raleigh, Columbia, Jacksonville, and Miami are highlighted by large bold block letters, while smaller cities and towns throughout the depicted region are labeled by using progressively smaller, less bolded font. All the highways (both U.S. and state) are marked by red lines and labeled, making the map, as previously stated, easy to use. (more details)
The edition of Colton's map of Florida published by Johnson and Browning.
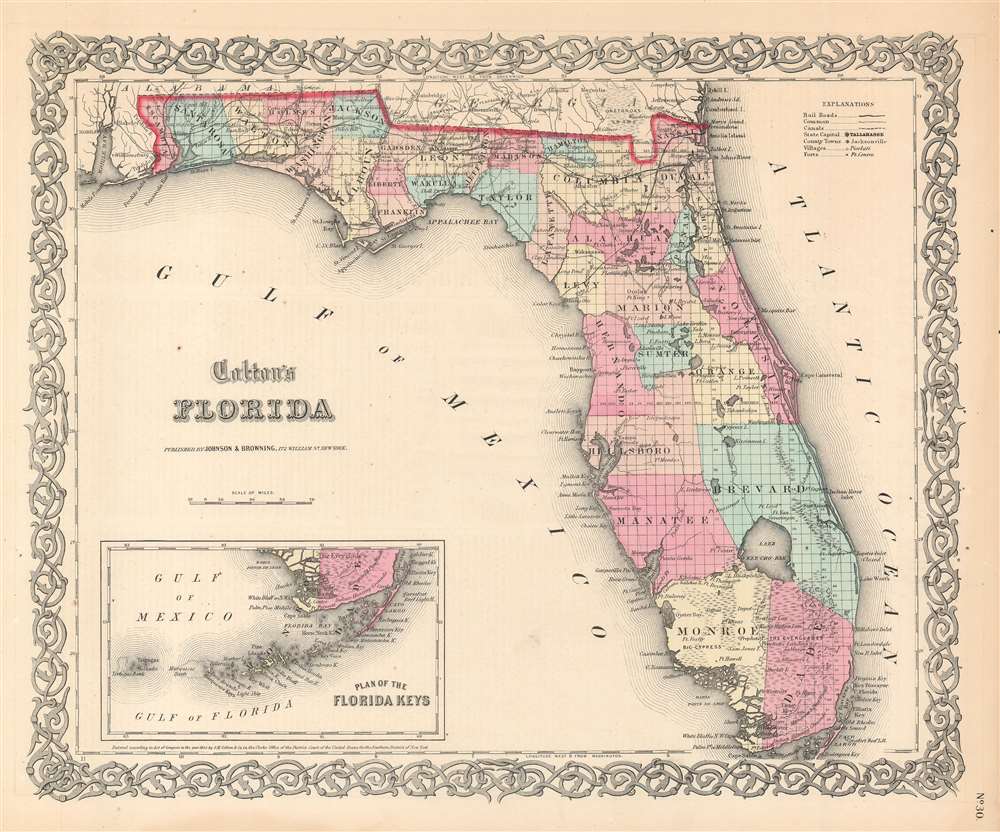
Colton's Florida.
sold
- Digital Map Information
- Suitable for large format printing
- File Size: 15.3 MB
- File Type: ZIP / TIFF
- ICC color profile embedded
- Delivered instantly via download link
This is an 1859 Joseph Hutchins Colton map of Florida published by Alvin Jewett Johnson and Ross Browning. The map depicts the region from Mobile Bay to the Atlantic Ocean and from Alabama and Georgia to the Gulf of Mexico and Cape Sable. Cities and towns throughout the state are labeled, including Tallahassee, Pensacola, St. Augustine, and Tampa. Counties are labeled and shaded different colors to allow for easy differentiation, and the entire state is gridded into townships. Roads, railroads, rivers, and lakes are also illustrated and labeled, as are bays, keys, and islands along the coastline. The whole is surrounded by Colton's spiral motif border. (more details)
Includes vignettes of Florida State University, the University of Tampa, and the University of Miami.
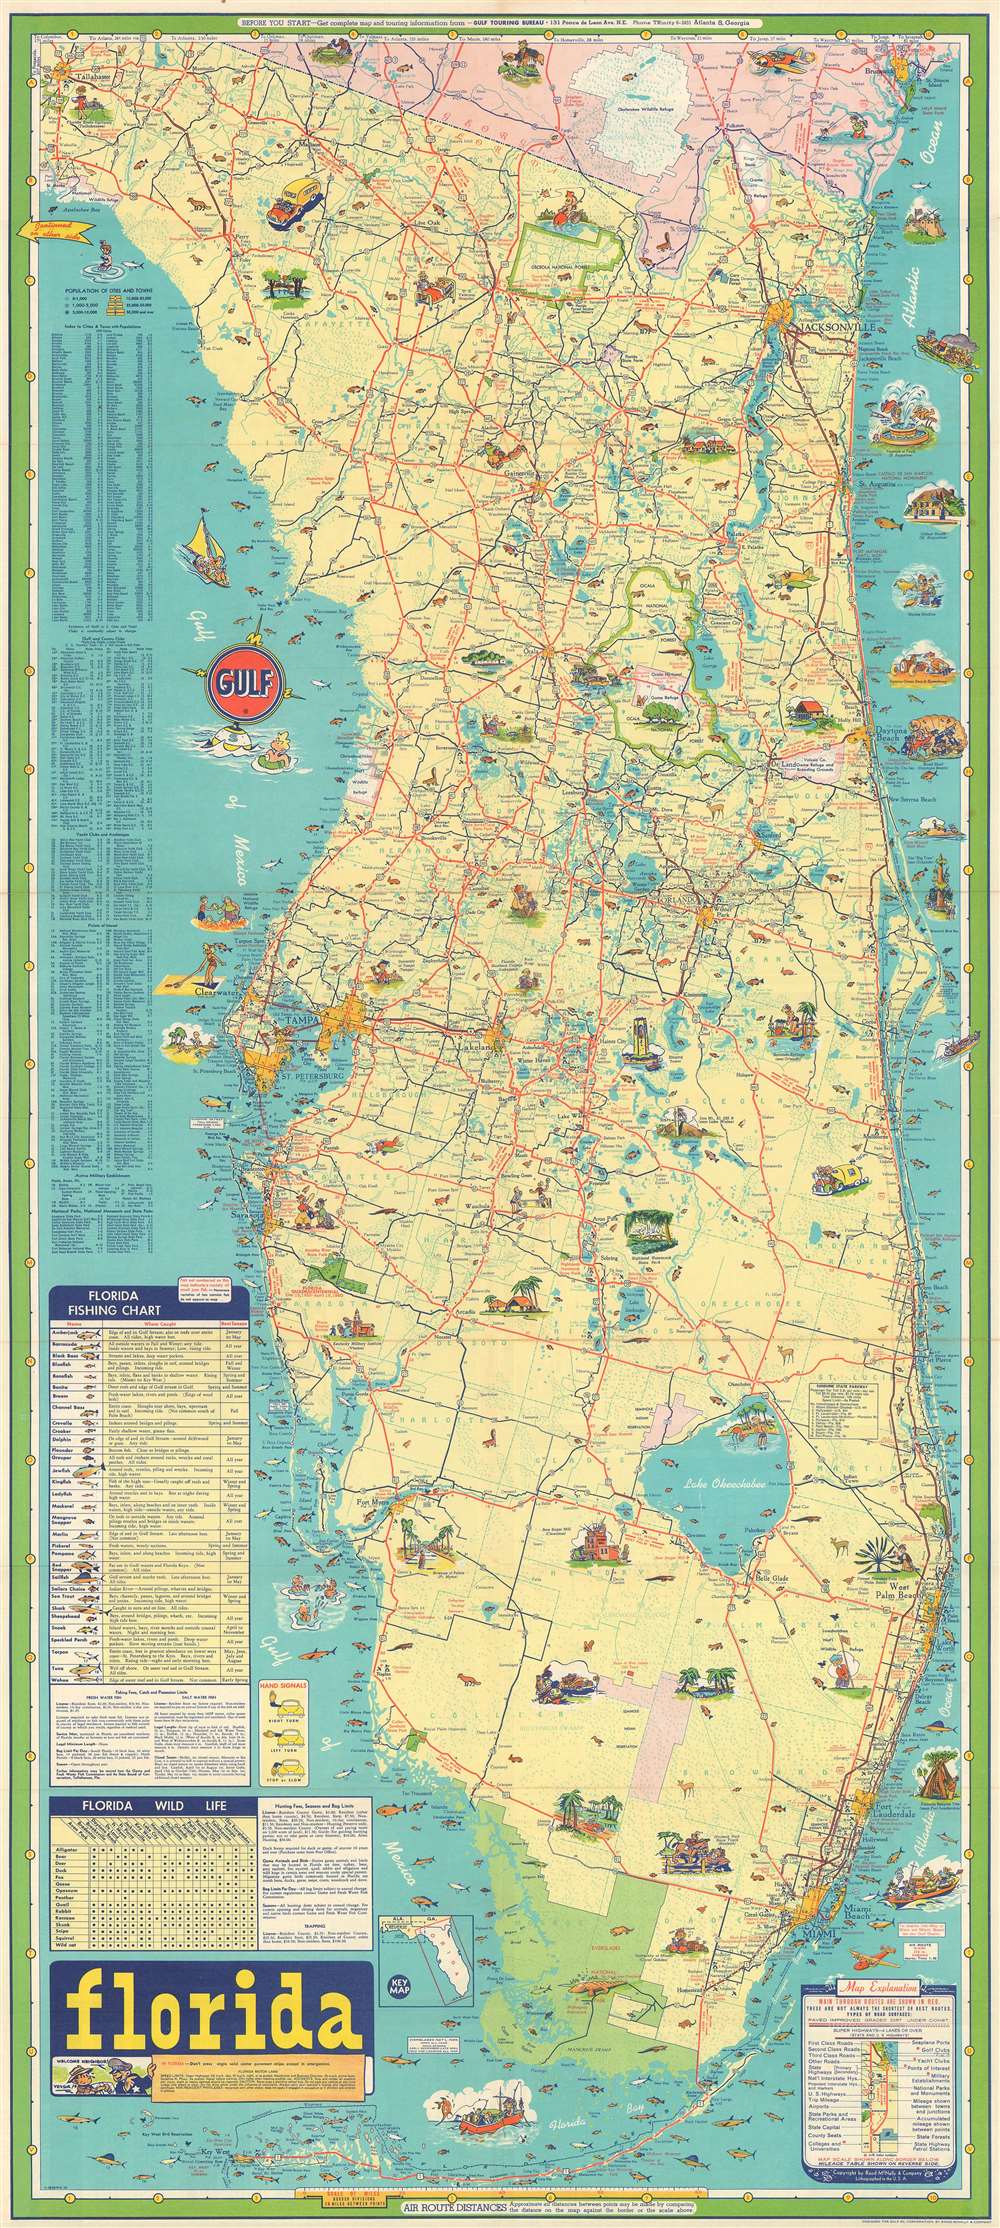
Florida.
sold
- Digital Map Information
- Suitable for large format printing
- File Size: 52.1 MB
- File Type: ZIP / TIFF
- ICC color profile embedded
- Delivered instantly via download link
This is a c. 1960 Rand McNally pictorial road map of Florida. The map depicts the region from Tallahassee to the Atlantic Ocean and from Georgia to the Florida Keys. Comical vignettes are interspersed throughout the state, illustrating sites from Tallahassee to the Keys. Florida State University is highlighted, as is the Fountain of Youth in St. Augustine, the band shell in Daytona Beach, the Singing Tower at the Singing Tower and Mountain Lake Sanctuary. Other vignettes highlight Sanlando Springs near Orlando, the Brevard Bird Reserve, Turtle Mound State Monument, the Avenue of Palms in Fort Myers, the University of Miami in Coral Gables, and the University of Tampa in Tampa. Cities and towns from Tallahassee to Miami are illustrated and labeled as well, including Tampa, St. Petersburg, Orlando, Jacksonville, Tallahassee, Miami, Miami Beach, and Fort Lauderdale.
Everglades National Park in southern Florida is shaded green and is illustrated by a very happily sleeping alligator and a small illustration of a puma. Small illustrations of Florida wildlife are scattered all across the state, and nineteen different species of fish native to Florida's coasts are noted as well. Each species is even numbered and corresponds to a fishing chart situated along the left border which names all nineteen species, where they are caught, and the best time of year to catch each one. Indexes of cities, golf and country clubs, yacht clubs and anchorages, points of interest, active military establishments, national parks, national monuments, and state parks are also included along the left border. A key in the lower right corner explains the various notations used on the map. (more details)
Everglades National Park in southern Florida is shaded green and is illustrated by a very happily sleeping alligator and a small illustration of a puma. Small illustrations of Florida wildlife are scattered all across the state, and nineteen different species of fish native to Florida's coasts are noted as well. Each species is even numbered and corresponds to a fishing chart situated along the left border which names all nineteen species, where they are caught, and the best time of year to catch each one. Indexes of cities, golf and country clubs, yacht clubs and anchorages, points of interest, active military establishments, national parks, national monuments, and state parks are also included along the left border. A key in the lower right corner explains the various notations used on the map. (more details)
A popular summer camp destination!
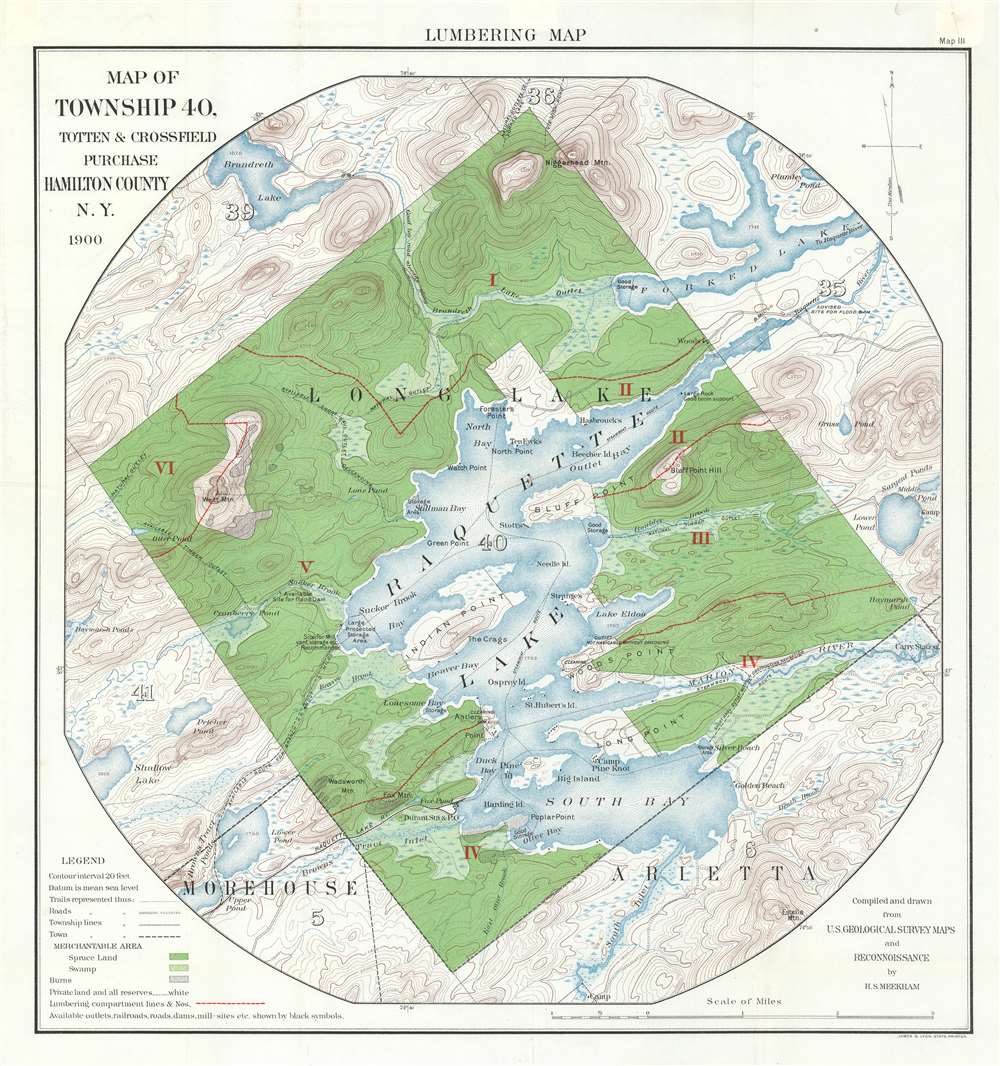
Lumbering Map. Map of Township 40, Totten and Crossfield Purchase. Hamilton County, N.Y.
sold
- Digital Map Information
- Suitable for large format printing
- File Size: 31.37 MB
- File Type: ZIP / TIFF
- ICC color profile embedded
- Delivered instantly via download link
A both nostalgic and historically significant piece, this 1900 H.S. Meekham map of Raquette Lake in Hamilton County, New York highlights a region known for summer camps and illustrates New York State's drive to protect natural forested land. The map depicts Township 40 from its borders with Townships 39 and 36 to its borders with Townships 5 and 6 and from Township 41 and 5 to Township 35 and Forked Lake. Several locations are labeled around Raquette Lake including Indian Point, Beaver Bay, Antler's Point, Long Point, South Bay, Bluff Point, and North Bay. Camp Pine Knot is depicted on Long Point. The Raquette Lake Railway is illustrated in the lower left quadrant, along with Durant Station and Post Office. Roads, trails, and towns are also noted. Raquette Lake remains a popular summer camp destination to this day. (more details)
Highlights American army and navy bases, including both naval stations and army and navy airfields.
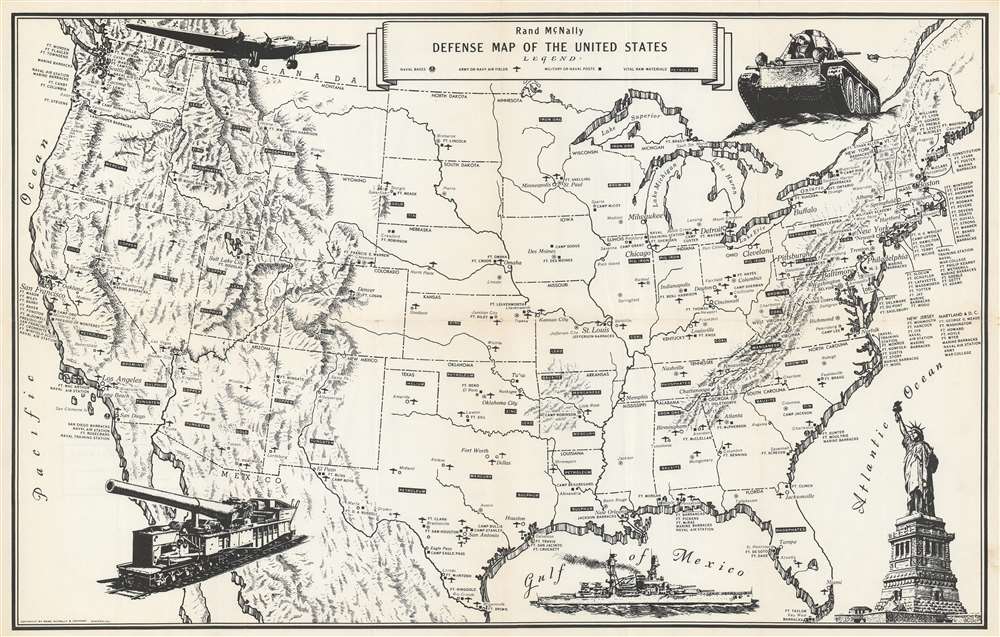
Rand McNally Defense Map of the United States.
sold
- Digital Map Information
- Suitable for large format printing
- File Size: 25.27 MB
- File Type: ZIP / TIFF
- ICC color profile embedded
- Delivered instantly via download link
This is a c. 1941 Rand McNally map of United States military installations and strategic mineral deposits. The map depicts the continental United States from the Pacific Ocean to the Atlantic Ocean and from Canada to Mexico. U.S. army and navy bases are identified throughout the country, with different symbols used to mark specific types of installations. Naval bases are marked by and anchor inscribed in a circle, while army and navy air fields are highlighted by a silhouette of an airplane. It is important to note that at this point in American history, there was no independent U.S. Air Force. Prior to 1947, when the U.S. Air Force was established, land-based military aircraft had been the responsibility of the U.S. Army Air Forces, while sea-based operations were conducted by the U.S. Navy. The U.S. Marine Corps also had its own aviation division meant for close air support of Marine Corps operations. Other army or navy posts are marked by a black square. Strategic resources, such as oil (petroleum), gold, tin, mercury, coal, and iron (among others) are scattered throughout the map and are noted by while block letters inside in a black box. Little other detail is included, except state capitals that do not host a military base are labeled. Five pictorial vignettes adorn the map. Beginning in the upper left corner and moving clockwise an airplane, a tank, the Statue of Liberty, a battleship, and a rail gun are illustrated. (more details)
An rare city map of Toulouse, France, a city which dates back to Roman times.
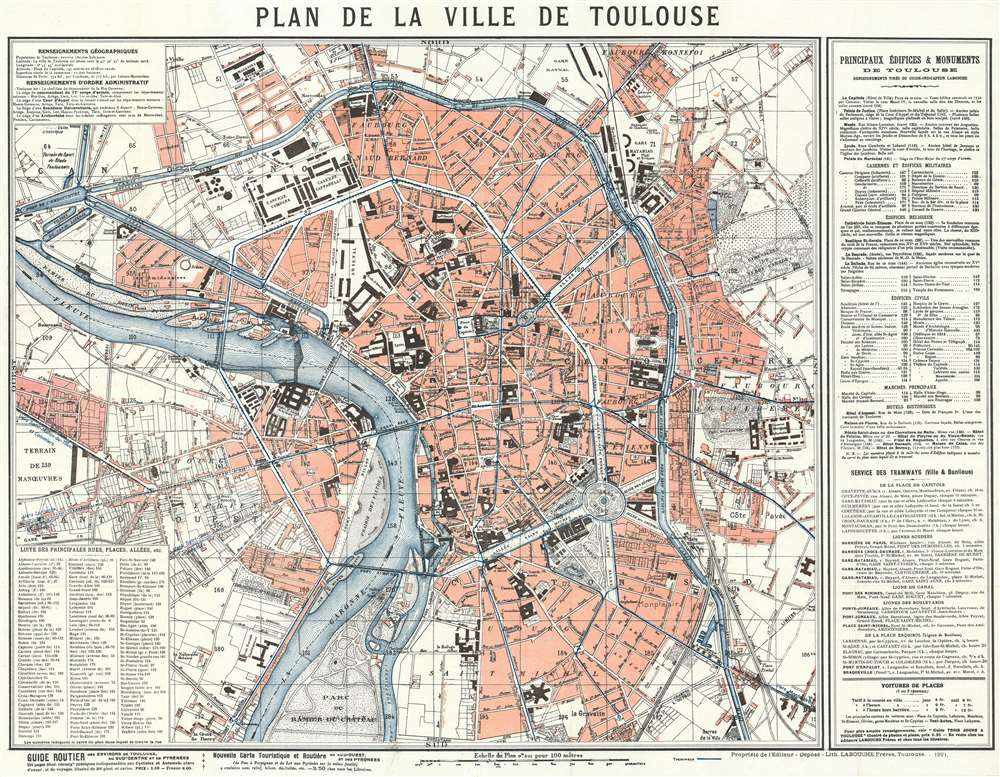
Plan de la Ville de Toulouse.
sold
- Digital Map Information
- Suitable for large format printing
- File Size: 35.79 MB
- File Type: ZIP / TIFF
- ICC color profile embedded
- Delivered instantly via download link
This is a 1921 Labouche Frères city map or plan of Toulouse, France. The map depicts the city from the Gare de Toulouse to the Cimetière de Terre Cabade and from the Gare Raynal to the Parc du Ramier du Chateau, which is most likely where the Stade TFC is situated today. Myriad buildings are labeled throughout, such as train stations, churches, government buildings, and schools. Roads, town squares, and parks are also identified. Town districts are noted. An index of major buildings throughout the city, including churches, military posts, City Hall, the town markets, and historic buildings, is situated along the right border, while a street index is included in the lower left corner. Both maps give the location of each site relative to its location on the map's grid, since the entire map is divided up into a grid and each square is assigned a number. That way the viewer can locate anywhere that they want to go. (more details)
Highlights Mount Morris Park, which hosted the Harlem Cultural Festival, known as the Black Woodstock, in 1969.
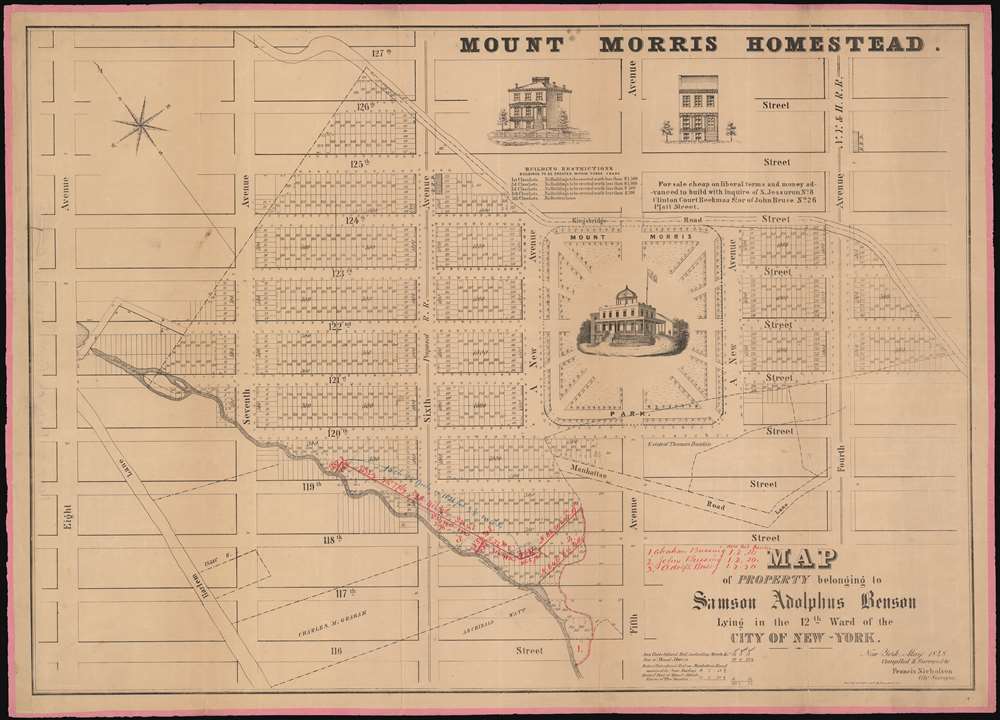
Map of the Property belonging to Samson Adolphus Benson Lying in the 12th War of the City of New-York.
sold
- Digital Map Information
- Suitable for large format printing
- DPI: 600
- File Size: 42.43 MB
- File Type: ZIP / TIFF
- ICC color profile embedded
- Delivered instantly via download link
A fine example Francis Nicholson's rare 1848 cadastral map of the Mount Morris Park historic district - the only specific map of this area to appear in the 19th century. The map depicts the region from Eighth Avenue to Fourth Avenue and from 127th Street to 116th Street. Streets and avenues are identified and all the buildings and city blocks are numbered. Harlem Creek, which has long since been buried under the development of Manhattan, is illustrated. Manuscript notations in red ink illustrate the land holdings of Abraham Bussing, John Bussing, and Adolph Bussing. (more details)
Illustrates the U.S. Capital, the Washington Monument, and the Lincoln Memorial, among other famous Washington, D.C. sites.
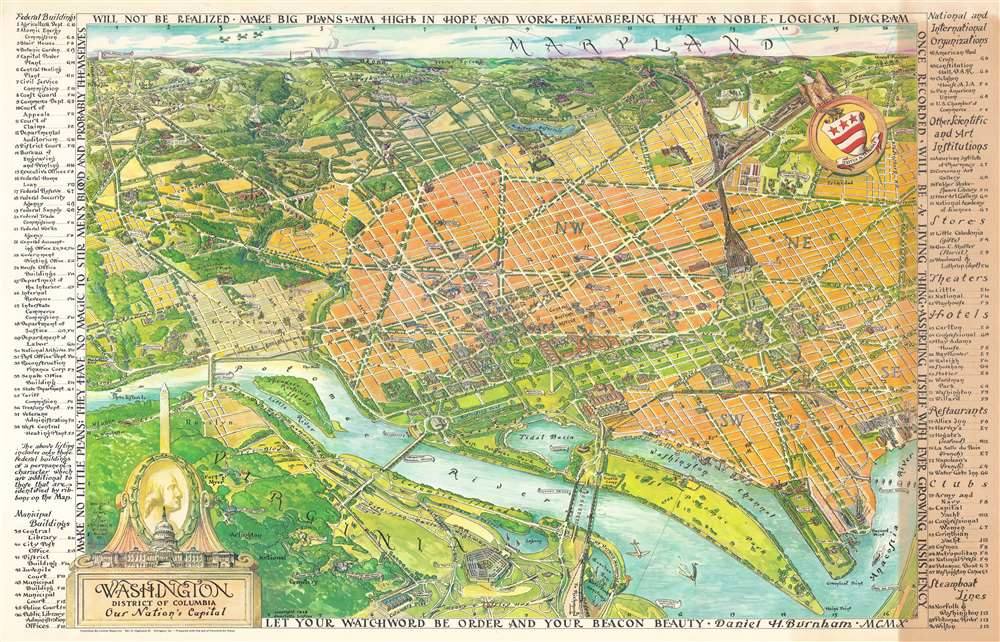
Washington District of Columbia Our Nation's Capital.
sold
- Digital Map Information
- Suitable for large format printing
- File Size: 86.09 MB
- File Type: ZIP / TIFF
- ICC color profile embedded
- Delivered instantly via download link
This is a 1949 Oliver Whitwell Wilson pictorial bird's eye view of Washington, D.C. The map depicts the region from the southeast, looking from Virginia across Washington, D.C. to Maryland. Numerous government buildings monuments and throughout the city are illustrated and labeled, including the Capital Building, the White House, the Supreme Court, the Washington Monument, the Lincoln Memorial, and the Jefferson Memorial. Other landmarks are identified, including the Smithsonian Institution, the National Gallery of Art, the Reflecting Pool, Ford's Theater, and the Library of Congress. Other fixtures around Washington, D.C. are also highlighted, such as George Washington University, Georgetown University, the Naval Observatory, and Union Station. Streets are illustrated, although not all are labeled. Across the river in Virginia, Arlington National Cemetery, complete with the Tomb of the Unknown Soldier, the U.S.S. Maine mast, and Arlington House. The Pentagon, not even ten years old at the time, is also illustrated. Rosslyn is labeled. Outside Washington to the north, several roads are labeled, as are Rock Creek Park, the Army Medical Center, the U.S. Soldier's Home, Catholic University, and, along the horizon, Bethesda, Maryland. George Washington's coat of arms is illustrated in the upper right quadrant at the center of a compass. In the lower right sits a decorative title cartouche featuring an illustration of the Capital, the Washington Monument, and a portrait of George Washington, the first President of the United States. An index of ninety different locations throughout the city is situated along both the left and right borders and includes federal buildings, municipal buildings, scientific and art institutions, stores, theaters, hotels, and restaurants. Each is numerically identified both in the index and on the map, and the index also provides each building's grid location on the map. (more details)
A beautiful color view of a Parisian palace that was burned during the French Commune.

Vue du Palais des Tuileries prise du bas de al terrasse du bord de l'eau.
sold
- Digital Map Information
- Suitable for large format printing
- DPI: 600
- File Size: 15.16 MB
- File Type: ZIP / TIFF
- ICC color profile embedded
- Delivered instantly via download link
This is a c. 1845 Jules Arnout view of the Palais des Tuileries in Paris, France. The Palais des Tuileries was a French royal palace located in Paris located between the Jardin des Tuileries (Tuileries Gardens) and the Jardin du Carrousel along today's Avenue du Général Lemonnier and was attached to the Louvre. The view, drawn from the Jardin des Tuileries, illustrates Parisians going about their day and enjoying the beauty of the gardens. Marble statuary are placed throughout the garden, and numerous flowers are in bloom. (more details)
A psychedelic fantastical map of the world bordered by nightmarish creatures.

Humbead's Revised Map of the World with List of Population.
sold
This is an iconic 1970 Earl Crabb and Rick Shubb map of the world, the last of three different editions of Humbead's Revised Map of the World. Celebrated for its place in the history of the West Coast folk scene and the hippie counterculture, the map depicts a world reimagined from this perspective. Much like the 1969 edition, San Francisco, Berkeley, Los Angeles, New York City, and Cambridge dominate one large continent, with Southeast Asia, North Africa, and Boston making up the rest of this landmass. Places within these cities are illustrated and labeled as well, adding some detail to the map. In San Francisco, for example, Golden Gate Park is illustrated, and Vancouver, Seattle, Portland, Santa Barbara, and Marin County are labeled. In New York City, Washington Square Park and Central Park, while Harlem, Chicago, and New Orleans are dots on the map. Southeast Asia is situated between San Francisco and Los Angeles, while the entire continent of Africa is situated between Cambridge and New York City. Nashville sits at the center of the continent, perhaps a reference to Crabb and Shubb's love of folk music.
This Pangea-esque continent is illustrated on a beige background meant to represent the ocean given that it is labeled as 'The Farspooming Ocean' and 'The Whelming Brine'. Gigantic scrolls of parchment are also illustrated underneath the continent and bear a list of over 1,300 names - the population to which the map's title refers. Among the celebrities references are Stanley Kubrick, Salvador Dali, Peter Cushing, Pablo Picasso, Stan Lee, and John Lennon. The whole is surrounded by a border that borders on the nightmarish. Fantastical beasts appear everywhere, psychedelically colored with numerous limbs, all reminiscent of the beasts described during the acid trips in Hunter S. Thompson's 1971 classic Fear and Loathing in Las Vegas. In many ways the border defies explanation; it simply must be viewed to be appreciated. (more details)
This Pangea-esque continent is illustrated on a beige background meant to represent the ocean given that it is labeled as 'The Farspooming Ocean' and 'The Whelming Brine'. Gigantic scrolls of parchment are also illustrated underneath the continent and bear a list of over 1,300 names - the population to which the map's title refers. Among the celebrities references are Stanley Kubrick, Salvador Dali, Peter Cushing, Pablo Picasso, Stan Lee, and John Lennon. The whole is surrounded by a border that borders on the nightmarish. Fantastical beasts appear everywhere, psychedelically colored with numerous limbs, all reminiscent of the beasts described during the acid trips in Hunter S. Thompson's 1971 classic Fear and Loathing in Las Vegas. In many ways the border defies explanation; it simply must be viewed to be appreciated. (more details)
Depicts the entire East Coast of the United States from Bangor, Maine to Miami, Florida.

The Short Highway.
sold
- Digital Map Information
- Suitable for large format printing
- File Size: 4.28 MB
- File Type: ZIP / TIFF
- ICC color profile embedded
- Delivered instantly via download link
This is a 1937 Lafayette Highway Association map of U.S. Highway 1, the longest north-south road in the United States. The map depicts the East Coast of the United States from Bangor, Maine to Miami, Florida and from Rochester, New York to the Atlantic Ocean. Several highways, highlighted in red, correspond to the routes that this pamphlet is promoting. These include Highways 1, 15, 15A, 17, and 41. Distances between cities along this highlight route are also noted on the map. Numerous other highways are also illustrated and provide other options when traveling north or south along the Eastern Seaboard. Cities are labeled both along the promoted highways and the others. Little other geographical detail is provided. A stamp on the verso implies that this particular example must have been distributed by Steve's Restaurant in Fayetteville, North Carolina. (more details)
An atlas map of the United States published at the height of the American Civil War.
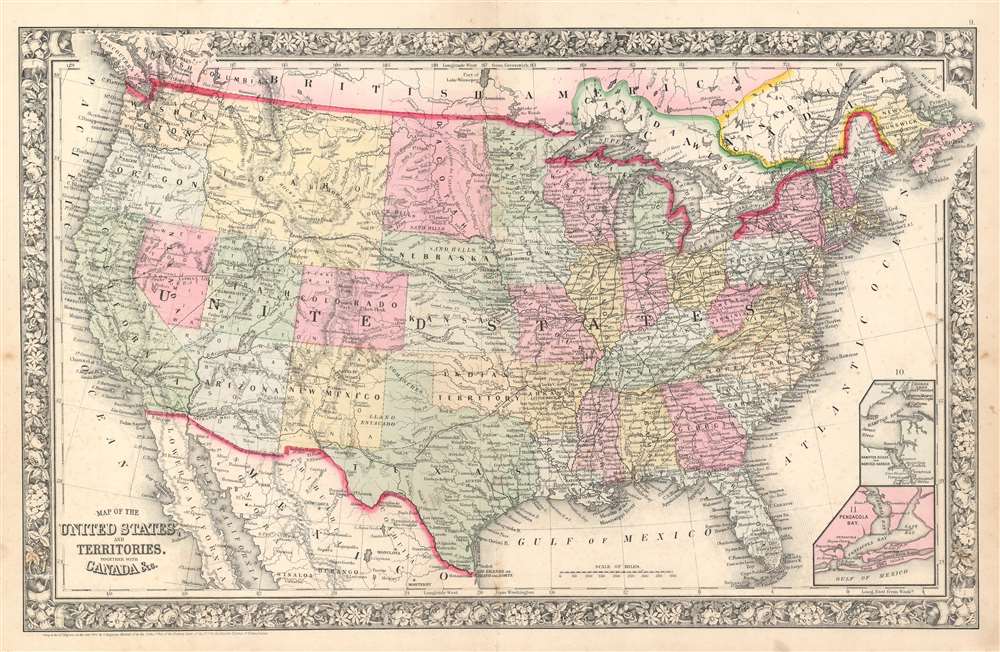
Map of the United States, and Territories. Together with Canada etc.
sold
- Digital Map Information
- Suitable for large format printing
- File Size: 24.17 MB
- File Type: ZIP / TIFF
- ICC color profile embedded
- Delivered instantly via download link
This is an 1863 Samuel Augustus Mitchell, Jr. map of the United States. The map depicts the region from the Pacific Ocean to the Atlantic Ocean and Nova Scotia and from Canada to Mexico. An ephemeral configuration of the western states is illustrated here, with Washington State and Oregon occupying basically the same borders that they do today, but Idaho takes up the entirety of the modern-day state of Idaho as well as Montana and Wyoming. North and South Dakota have yet to be established, leaving that region to be simply named Dacotah. Arizona stretches out along the 36th parallel to the California border, cutting into a large portion of southern modern day Nevada, including Las Vegas.
Apart from the geographical differences between the borders of today's states and those of 1863, a wealth of other details are included here. Innumerable cities and towns are labeled, as are forts, lakes, rivers, and waterfalls. The railroad network in the eastern states is illustrated by solid black lines that had not yet reached out west. There, the famous Pony Express Route is identified, as is the Mail Route through Texas, New Mexico, and Arizona to California. Other trails, such as the Route to Santa Fe and the Wagon Road to Salt Lake from Southern California are also illustrated. Two inset maps situated in the lower right corner illustrate Hampton Roads and Pensacola Bay. (more details)
Apart from the geographical differences between the borders of today's states and those of 1863, a wealth of other details are included here. Innumerable cities and towns are labeled, as are forts, lakes, rivers, and waterfalls. The railroad network in the eastern states is illustrated by solid black lines that had not yet reached out west. There, the famous Pony Express Route is identified, as is the Mail Route through Texas, New Mexico, and Arizona to California. Other trails, such as the Route to Santa Fe and the Wagon Road to Salt Lake from Southern California are also illustrated. Two inset maps situated in the lower right corner illustrate Hampton Roads and Pensacola Bay. (more details)
An attractive 19th century atlas map of New Orleans.
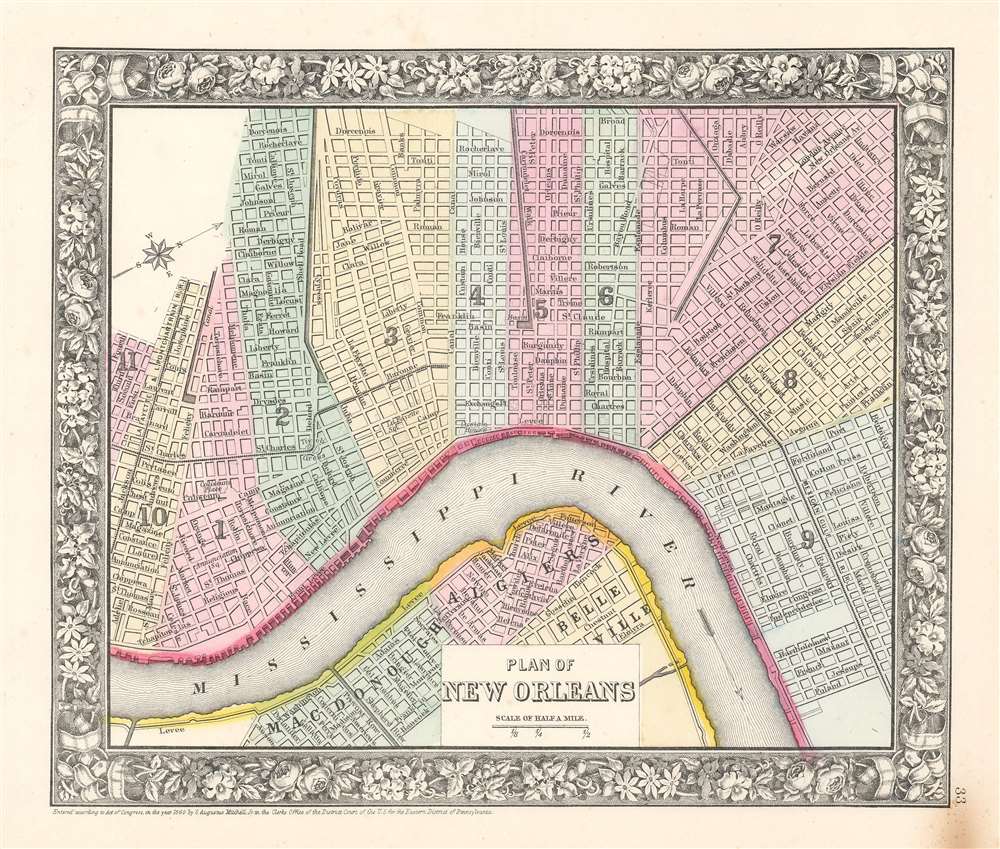
Plan of New Orleans.
sold
- Digital Map Information
- Suitable for large format printing
- File Size: 10.63 MB
- File Type: ZIP / TIFF
- ICC color profile embedded
- Delivered instantly via download link
This is an 1863 Samuel Augustus Mitchell, Jr. city map or plan of New Orleans, Louisiana. The map depicts the region from Fourth Street to Poland Street and from Broad Street to the Algiers neighborhood. Highly detailed, myriad streets are illustrated and labeled throughout. City wards are shaded different colors to allow for easy differentiation. The Mississippi River is labeled, as are the McDonogh (MacDonough), Algiers, and Belleville neighborhoods. The Lafayette and Lake Pontchartrain Railroad and the Mexican Gulf Railroad are also illustrated and labeled. (more details)
A detailed county map of the Pacific Northwest from the 19th century.
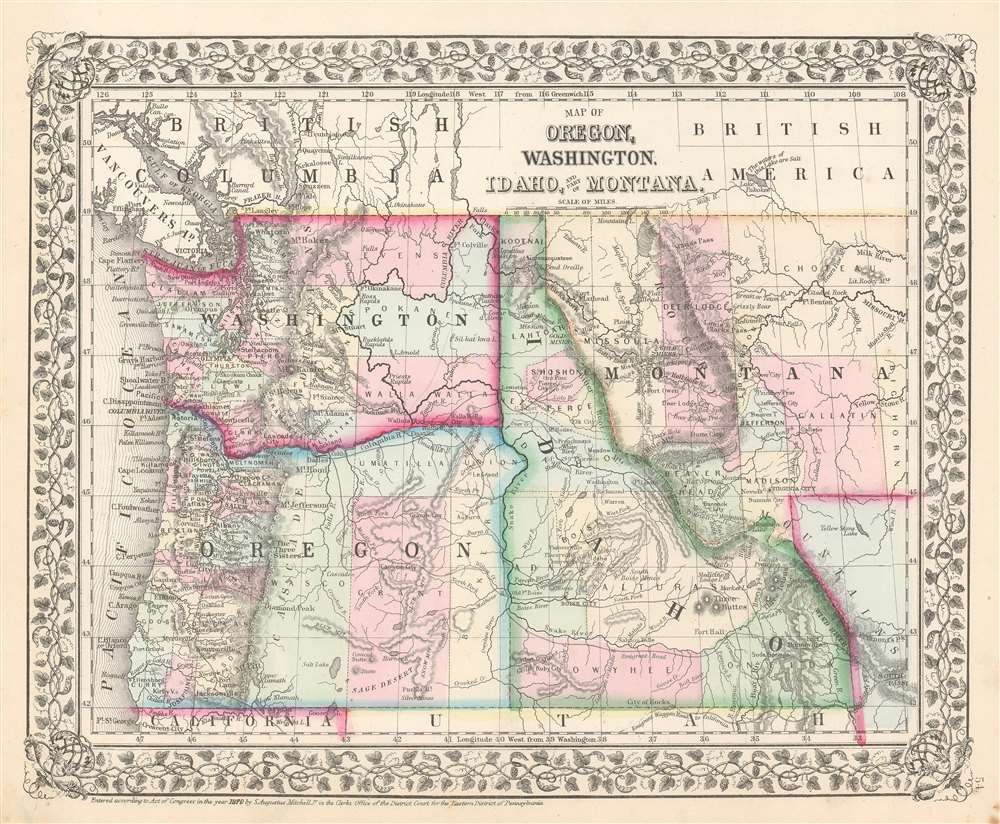
Map of Oregon, Washington, Idaho, and Part of Montana.
sold
- Digital Map Information
- Suitable for large format printing
- File Size: 12.37 MB
- File Type: ZIP / TIFF
- ICC color profile embedded
- Delivered instantly via download link
This is an 1870 Samuel Augustus Mitchell, Jr. map of Oregon, Washington, Idaho, and Montana. The map depicts the region from the Pacific Ocean to Bighorn County, Montana and South Pass, Wyoming and from Canada to California and Utah. Highly detailed, myriad cities, towns, and villages are labeled, including Seattle and Olympia in Washington, Salem and Eugene City in Oregon, Boise City in Idaho, and Virginia City and Missoula in Montana. Rivers are illustrated and labeled throughout, such as the Missouri River, the Yellowstone River, the Columbia River, and the Snake River. A handful of forts are labeled in western Montana. Counties are shaded different colors to allow for easy differentiation. (more details)