
Detail-Rich Map of the Mid Atlantic Coast of the United States
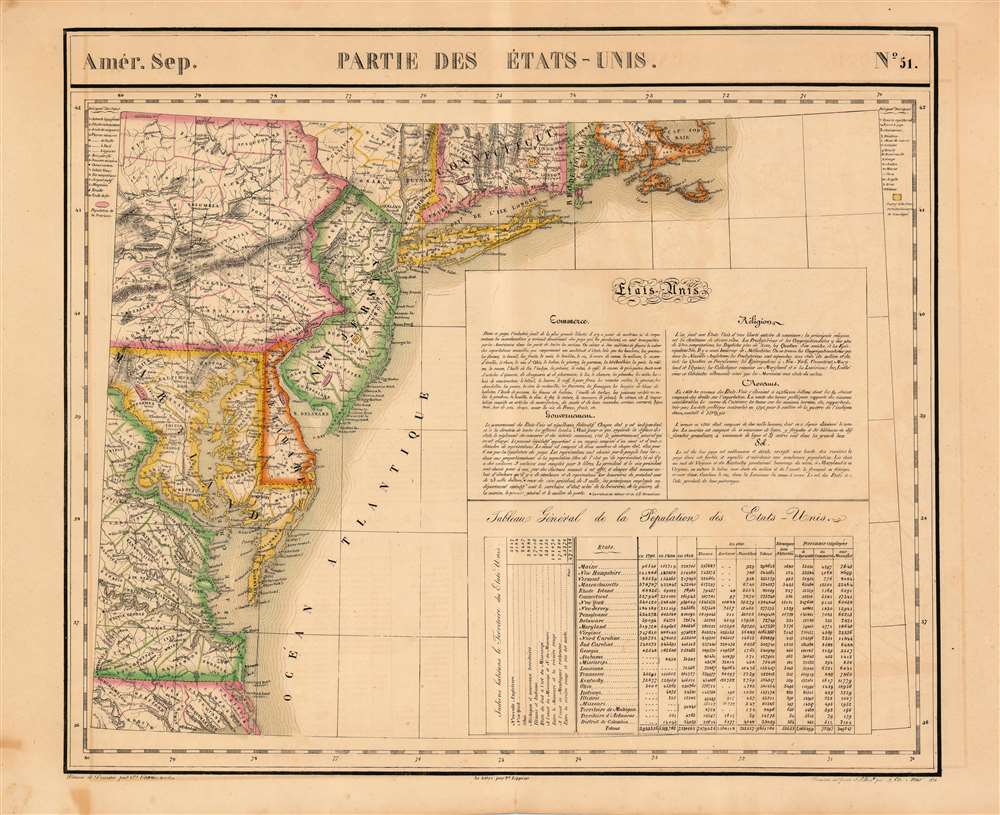
Parties des Etats-Unis. Amer. Sep. 51.
sold
- Digital Map Information
- Suitable for large format printing
- DPI: 600
- File Size: 27.82 MB
- File Type: ZIP / TIFF
- ICC color profile embedded
- Delivered instantly via download link
This is the 1827 Vandermaelen map of the Mid-Atlantic United States. Delaware and New Jersey are shown in completion; northeastern North Carolina, the eastern parts of Virginia, Maryland and Pennsylvania, southeastern New York, and the southern extents of Connecticut, Rhode Island and Massachusetts are shown as well. The map includes an extensive text gloss on the United States' trade offerings, religious groups, government, wealth and climate. A table tracks the young nation's population growth from 1790 to 1820, distinguishing between white, slave, and free black populations broken down state-by-state. Native American populations in each state are noted as well. Topography is shown with hachures. In addition to placenames, the map shows the location of Revolutionary War battles, urban populations, and various mineral resources (specific ones are noted using a key) (more details)
Scarce 1893 map of the Russian Frontier in Central Asia
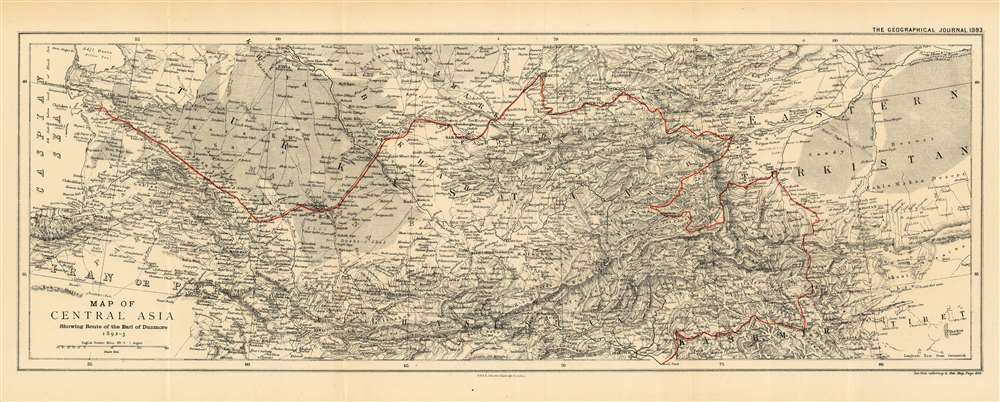
Map of Central Asia Showing the Route of the Earl of Dunmore 1892-3.
$450.00
Acquire
- Digital Map Information
- Suitable for large format printing
- File Size: 19.05 MB
- File Type: ZIP / TIFF
- ICC color profile embedded
- Delivered instantly via download link
This is an 1893 map by William and Alexander Keith Johnston of Central Asia, published by the Royal Geographic Society, to trace the route taken by the Earl of Dunmore in his travels through Kashmir, the Xinjiang province of China, Tajikistan, Kyrgyzstan, Uzbekistan, and through Turkmenistan to the Caspian Sea. The region - largely a Chinese frontier - was the site of significant Russian efforts to exert influence at the time, and it is in that context that the Earl of Dunmore’s journey took place. Following the track, for example, one sees what appears to be a curious detour into the Pamir mountains between Yarkand and Kashgar; here, Dunmore’s expedition was following a Chinese force sent to counter Russian incursions Aktash region. The region was also the site of conflict between Russian and Afghan forces - indeed, the journey took place only a few years before the border between Russia and Afghanistan was set with the signing of the Pamir Boundary Commission protocols in 1895. Dunmore's return route from Samarkand was undertaken on the Russian Trans-Caspian Railway; constructed in order to facilitate Russian troop movements along the frontier, the British considered this railway to be a particular threat to their interests in Asia. (more details)
Published only six weeks after the end of the Nigerian Civil War.

Nigeria. Headline-Focus Wall Map 10.
sold
- Digital Map Information
- Suitable for large format printing
- File Size: 59.18 MB
- File Type: ZIP / TIFF
- ICC color profile embedded
- Delivered instantly via download link
Published only six weeks after the Nigerian Civil War, this is a 1970 Civic Education Service map of Nigeria. Major cities are labeled throughout, with several highlighted in secessionist Biafra. (more details)
A fine place for an evening stroll...

Vue de la Place de la Concorde. Prise du Pont Louis XV.
sold
- Digital Map Information
- Suitable for large format printing
- DPI: 600
- File Size: 12.56 MB
- File Type: ZIP / TIFF
- ICC color profile embedded
- Delivered instantly via download link
This is an 1844 Jules Arnout view of the Place de la Concorde in Paris, France. With the Luxor Obelisk at its center, Parisians are illustrated wandering about the square, which stretches from the Avenue des Champs-Elysées to the Jardin des Tuileries. Ladies are dressed in fine dresses, while most of the men sport coats and top hats. The fountains surrounding the obelisk are illustrated in their finest, while carriages with drivers and footmen try to avoid those walking. The Hôtel de la Marine and its twin, which today houses the Hôtel de Crillon, are depicted in the background, with the Église de la Madeleine visible down the Rue Royale. (more details)
Most attractive in appearance…ideally illuminated and scientifically air conditioned!

The Queens Midtown Tunnel.
sold
- Digital Map Information
- Suitable for large format printing
- File Size: 6.58 MB
- File Type: ZIP / TIFF
- ICC color profile embedded
- Delivered instantly via download link
This is a 1941 New York City Tunnel Authority map promoting the virtues of the recently opened Queens Midtown Tunnel. Opened to traffic on November 15, 1940, the arteries into and out of the new tunnel are shaded red, with small black arrows indicating the flow of traffic. Major avenues and boulevards in Queens are illustrated in yellow, while Manhattan's famous street grid is shown from 34th Street to 47th Street and from Park Avenue to the East River. A slogan in the upper left corner reads, 'The Queens Midtown Tunnel is most attractive in appearance…ideally illuminated and scientifically air conditioned use it to save time, miles, and gas…use it in comfort and safety'. (more details)
Scarce, Richly Detailed Map of Mexico Showing the Republic of Texas

Carte Des États-Unis du Méxique.
sold
- Digital Map Information
- Suitable for large format printing
- DPI: 600
- File Size: 24.86 MB
- File Type: ZIP / TIFF
- ICC color profile embedded
- Delivered instantly via download link
This is an 1842 Pierre and Alexandre Lapie map of Mexico and the southwestern United States, which is one of the earliest non-American maps to include the Republic of Texas. The map depicts the region from the Pacific Ocean to the Mississippi River and from the Oregon Territory to the Yucatan Peninsula and the Pacific Ocean. The Republic of Texas is bordered in yellow, highlighting its existence. The map’s Texas detail is not limited to this superficial change, however: the whole Texas portion of the copperplate has been entirely reworked. Not only have the borders of the erstwhile nation been added, but also the whole area occupied by it has been updated, removing obsolete place names and replacing them with those in current use, including Austin, Houston and Nashville.
Mexico is bordered in green, with its borders extending from the Yucatan to the Oregon Territory encompassing all of California and the other southwestern states. States within Mexico are labeled and bordered by thin lines of varying colors to allow for easy differentiation. Cities and towns throughout Mexico are identified, including Mexico City, Cuernavaca, Veracruz, and Oaxaca, with Santa Fe, San Francisco, Monterey, Santa Barbara, and San Diego marked in northern Mexico, now the United States. Several Indian tribes are identified in northern Mexico, including the Apaches. A large portion of this region between the Rocky Mountains and the Pacific Coast is labeled as 'unknown'. Both the Great Salt Lake, identified as Lake Timpanogos, and Utah Lake, labeled as Lake Teguayo, are illustrated following the example of Humboldt. The apocryphal Buenaventura River is also included and is illustrated as connecting from Lake Teguayo to the Pacific Ocean, the final incarnation of the long-sought River of the West, a speculative alternative to the Northwest Passage. In the United States as it existed in 1838, only rivers are illustrated, and a handful of Indian tribes are referenced. An inset map of Central America is situated in the lower left corner and depicts the region from the Yucatan to Chagres, Panama (labeled Colombie). (more details)
Mexico is bordered in green, with its borders extending from the Yucatan to the Oregon Territory encompassing all of California and the other southwestern states. States within Mexico are labeled and bordered by thin lines of varying colors to allow for easy differentiation. Cities and towns throughout Mexico are identified, including Mexico City, Cuernavaca, Veracruz, and Oaxaca, with Santa Fe, San Francisco, Monterey, Santa Barbara, and San Diego marked in northern Mexico, now the United States. Several Indian tribes are identified in northern Mexico, including the Apaches. A large portion of this region between the Rocky Mountains and the Pacific Coast is labeled as 'unknown'. Both the Great Salt Lake, identified as Lake Timpanogos, and Utah Lake, labeled as Lake Teguayo, are illustrated following the example of Humboldt. The apocryphal Buenaventura River is also included and is illustrated as connecting from Lake Teguayo to the Pacific Ocean, the final incarnation of the long-sought River of the West, a speculative alternative to the Northwest Passage. In the United States as it existed in 1838, only rivers are illustrated, and a handful of Indian tribes are referenced. An inset map of Central America is situated in the lower left corner and depicts the region from the Yucatan to Chagres, Panama (labeled Colombie). (more details)
Rare World War II Imperial Japanese map of the Philippines.
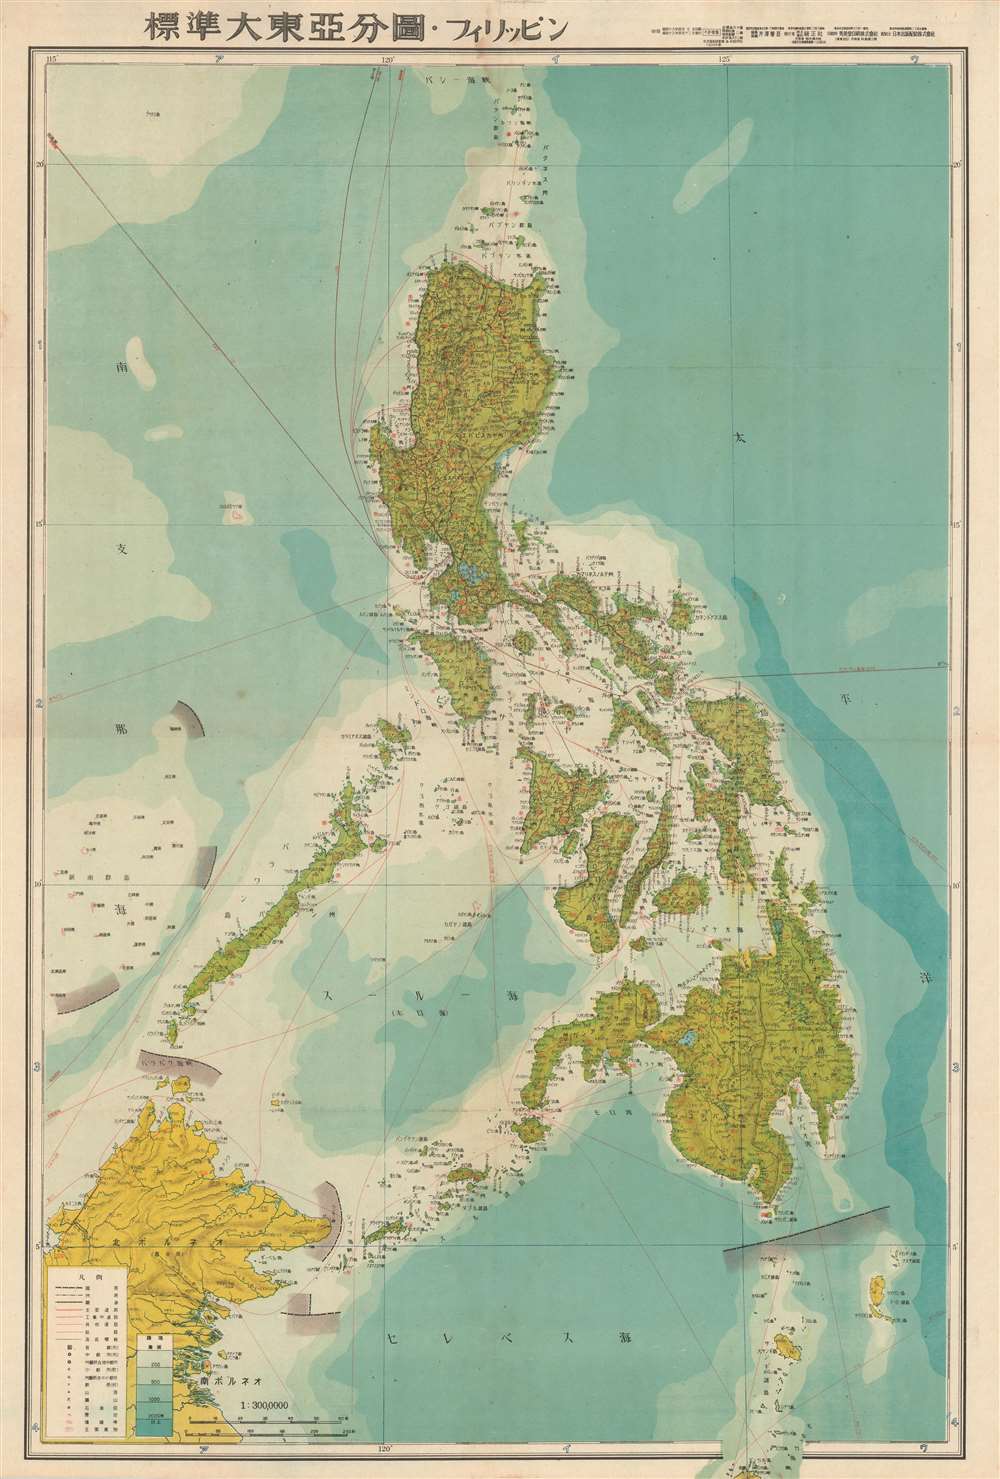
標準大東亞分圖 : フィリッピン / Standard Map of the Great East Asia: Philippines.
sold
- Digital Map Information
- Suitable for large format printing
- File Size: 27.24 MB
- File Type: ZIP / TIFF
- ICC color profile embedded
- Delivered instantly via download link
This is an an important and rare 1943 or Showa 18 Japanese map of the Philippines published during World War II. The map depicts the Philippine Islands from the small islands north of the Luzon to North Maluku, which appears just outside the printed border, and from northern Borneo to the Philippine Sea. Myriad locations throughout the islands are labeled in Japanese, with at least two different grades of roads illustrated on the major islands. Air and sea routes are illustrated and distances are noted, and variations in oceanic depth are indicated using blue shading. (more details)
Abundantly Data-Rich Midcentury Map of New York City
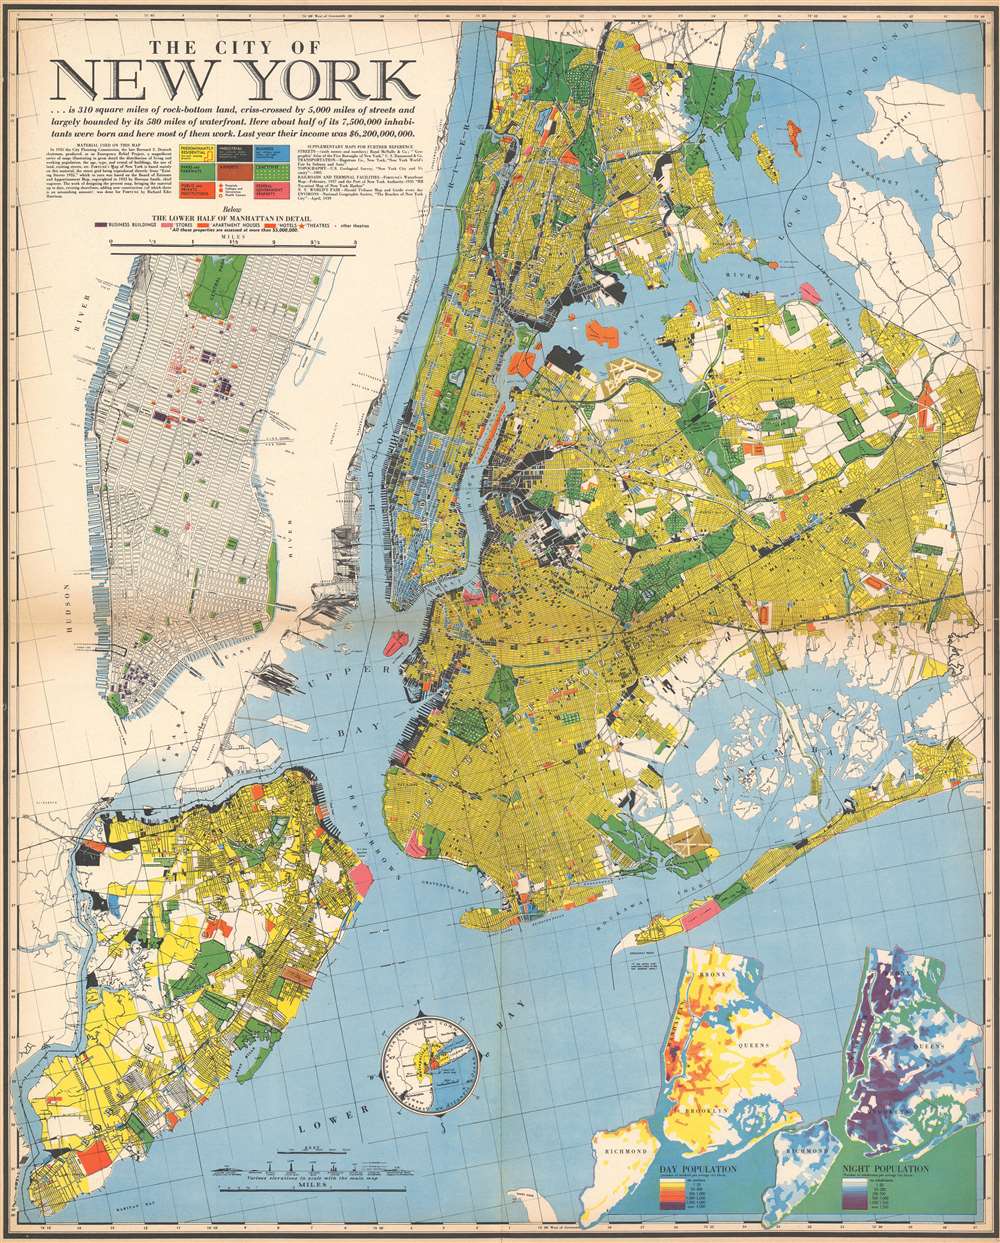
The City of New York.
sold
- Digital Map Information
- Suitable for large format printing
- File Size: 46.66 MB
- File Type: ZIP / TIFF
- ICC color profile embedded
- Delivered instantly via download link
This 1939 Richard Edes Harrison map of New York City - published in conjunction with the New York World’s Fair – represents a triumph of the visual display of quantitative information. Its aesthetic impact is all the more impressive in its clear expression of municipal and demographic data, making this a map of the people of New York City, as much as of the physical city itself. All five boroughs are represented in the primary map. On it, Harrison’s masterful use of vivid color to distinguish between residential, commercial, industrial, and federal use of land is clear yet supple, able to make distinction (for example) of low-income housing projects using the same palette. Parks and cemeteries both appear as green spaces, with white spots - evoking headstones - indicating the difference between the two. The two major airports (Floyd Bennett Field and North Beach Airport) are given their own color as well. The city’s industrial areas, shown in black, dominate the East River and Hudson coastlines, a reminder of the centrality of trade to the city’s development and history. (more details)
Richly Detailed Plan of Denver, Printed In Denver: Highlighting the City's Green Spaces
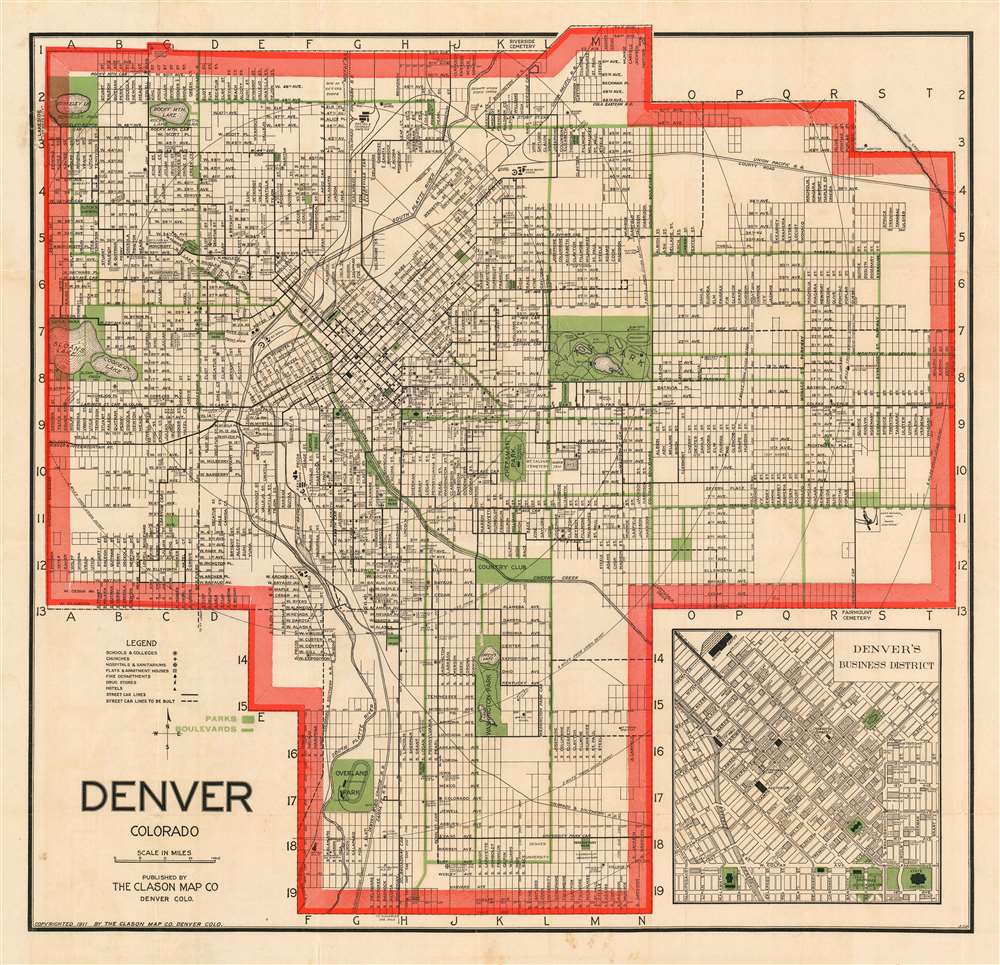
Denver Colorado.
sold
- Digital Map Information
- Suitable for large format printing
- File Size: 28.93 MB
- File Type: ZIP / TIFF
- ICC color profile embedded
- Delivered instantly via download link
An attractive example of George Clason's 1907 guidebook and map of Denver, Colorado. This map covers the growing city from Berkley Lake to Yale Avenue and from Sloans Lake to Yosemite Street. Concentric circles mark each mile's distance from Union Depot. Though the map has not expanded yet to include Aurora (as it would be in later editions) the municipality is marked in manuscript along Colfax Avenue between Ulster and Wabash streets. An inset in the lower right quadrant details the Denver Business District. (more details)
The Best Large-Scale Atlas Map of Afghanistan Prior to the Anglo-Afghan War
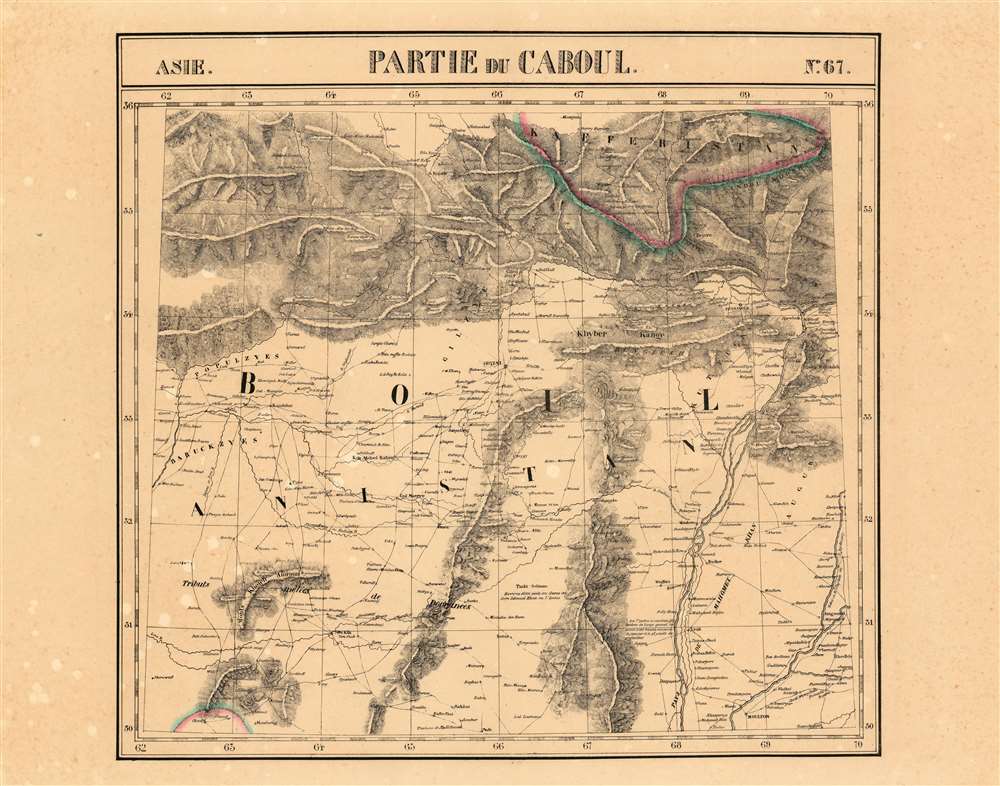
Partie du Caboul Asie no.67.
sold
- Digital Map Information
- Suitable for large format printing
- DPI: 600
- File Size: 30.9 MB
- File Type: ZIP / TIFF
- ICC color profile embedded
- Delivered instantly via download link
This is the 1827 Vandermaelen map of the Afghanistan, Pakistan and the Hindu Kush. It is the first large-scale atlas map to focus on the area, and the first to be executed in lithography. The map's detail - drawn from the first-hand exploration of John Macdonald Kinneir on behalf of the British East India Company - would not be improved upon until the First Anglo-Afghan War. (more details)
An allegorical map following the course of funding from the U.S. Treasury to the various New Deal alphabet agencies.

Financial Irrigation of the United States.
sold
- Digital Map Information
- Suitable for large format printing
- File Size: 17.7 MB
- File Type: ZIP / TIFF
- ICC color profile embedded
- Delivered instantly via download link
This is a 1943 LeRoy H. Appleton allegorical map of the distribution of funds from the U.S. Treasury to all the new government agencies created by President Franklin D. Roosevelt's New Deal. The U.S. Treasury sits at center in the background, with money (symbolized by the water) from taxes and government securities 'flowing' into it like water over a waterfall. From there, water travels into the coffers (illustrated as reservoirs) of the Public Works Administration (P.W.A.) and the Reconstruction Finance Corporation (R.F.C.), or through numerous smaller pipes running out of the Treasury. A network of smaller pipes running from the P.W.A. and R.F.C. reservoirs allow some water to flow into the ponds of the smaller alphabet agencies, as all these new government branches became known. The whole is divided roughly in half, with lending agencies occupying the greener side of the map, while spending agencies are located in the barren half. (more details)
Combines information about the Presidency, the Electoral College, major American political parties, and voting trends.
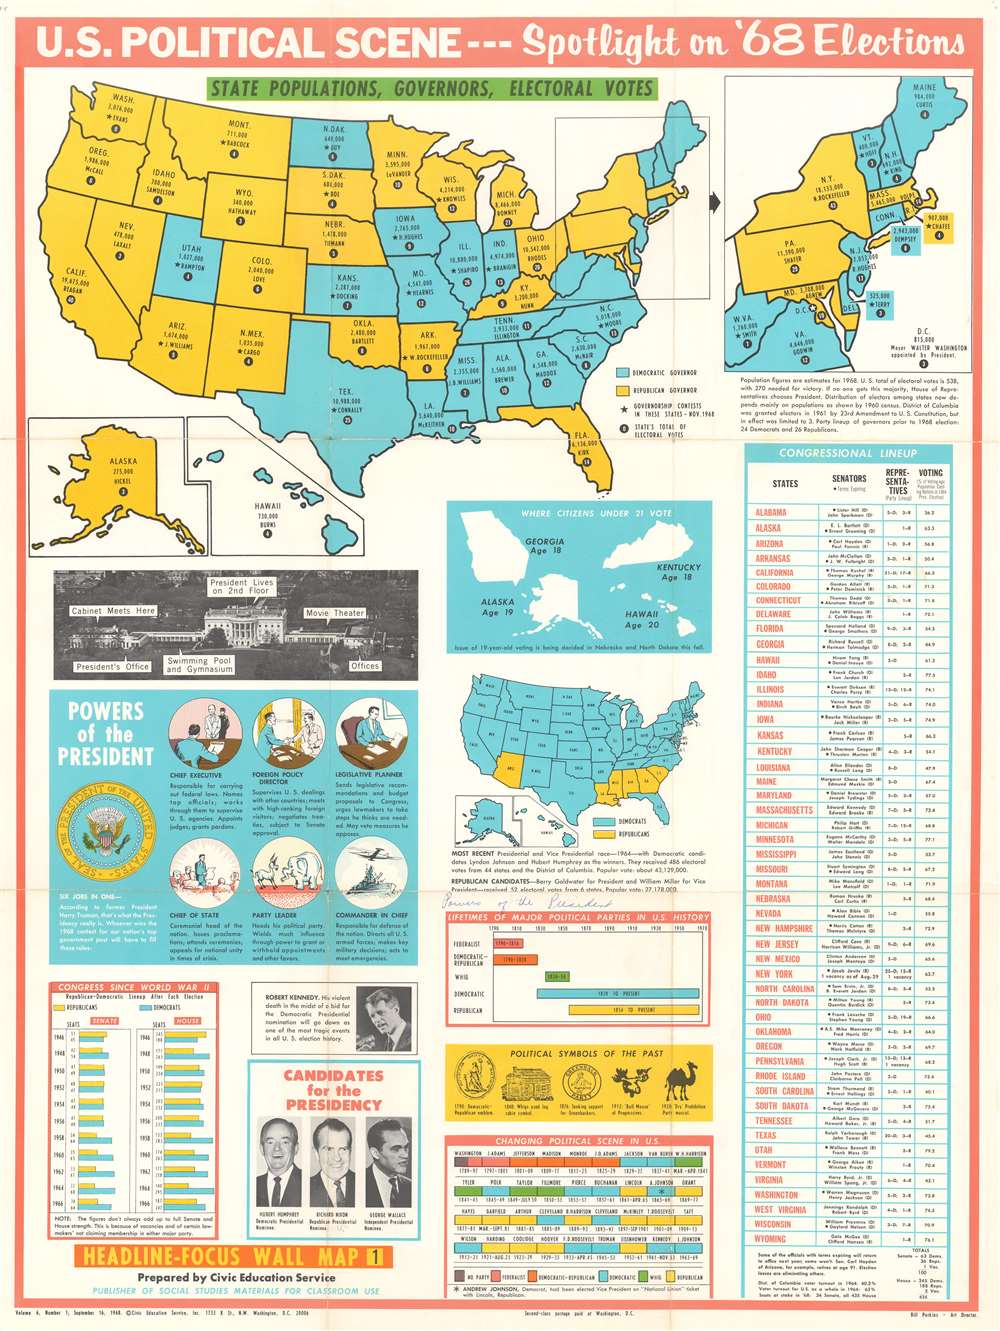
Headline Focus Wall Map 1. U.S. Political Scene - - Spotlight on '68 Elections.
sold
- Digital Map Information
- Suitable for large format printing
- File Size: 49.4 MB
- File Type: ZIP / TIFF
- ICC color profile embedded
- Delivered instantly via download link
This is a 1968 Civic Education Service broadside of the 1968 U.S. presidential election. The broadside combines an electoral map of the United States with information about the Presidency, American political history, voting trends, and photographs of the then-current candidates for the Presidency: Hubert Humphrey, Richard Nixon, and George Wallace. A political map of the United States occupies the top third of the broadside and provides viewers with information concerning each state's population, the governor's name, and the number of electoral votes allocated to each state. An inset to the right of the map of the continental U.S. focuses on the northeast, illustrating the region from Maine to Virginia. Two other insets, below and to the left of the large map, includes Alaska and Hawaii. (more details)
Pre-Interstate Arizona Tourist Icon: artifac of bygone way-stations on storied highways
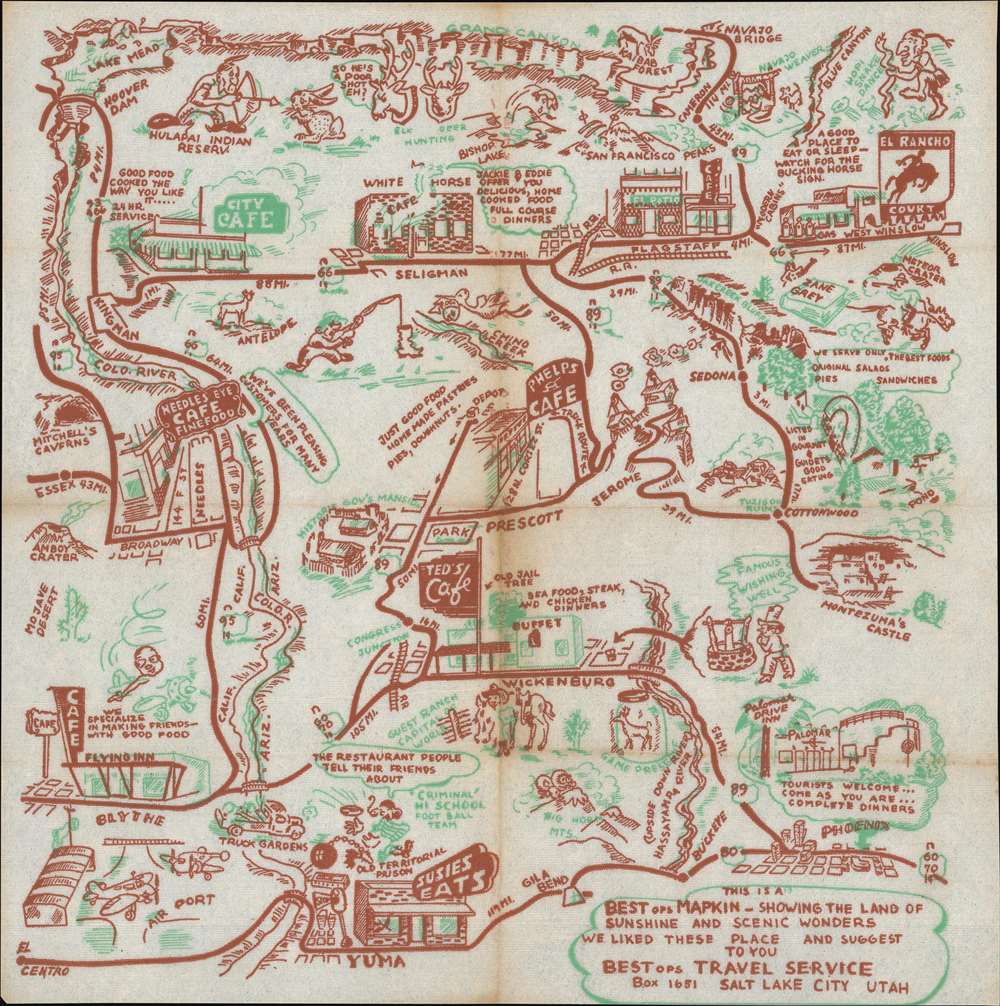
This Is A BESTops MAPKIN - Showing The Land of Sunshine and Scenic Wonders We Liked These Place and Suggest To You. BESTops Travel Service Box 1651 Salt Lake City Utah.
sold
- Digital Map Information
- Suitable for large format printing
- File Size: 9.94 MB
- File Type: ZIP / TIFF
- ICC color profile embedded
- Delivered instantly via download link
A rare survival: a 1948 map of northwestern Arizona, printed in two colors on a diner napkin. This 'Mapkin' represesnts a pictorial icon of the pre-interstate Arizona road trip, focusing specifically on the region encompassed by Yuma and Phoenix, Arizona in the south, up to the Grand Canyon in the north. (more details)
A pictorial map promoting Richard Byrd's second expedition to the Antarctic and the radio broadcasts he made along the way.
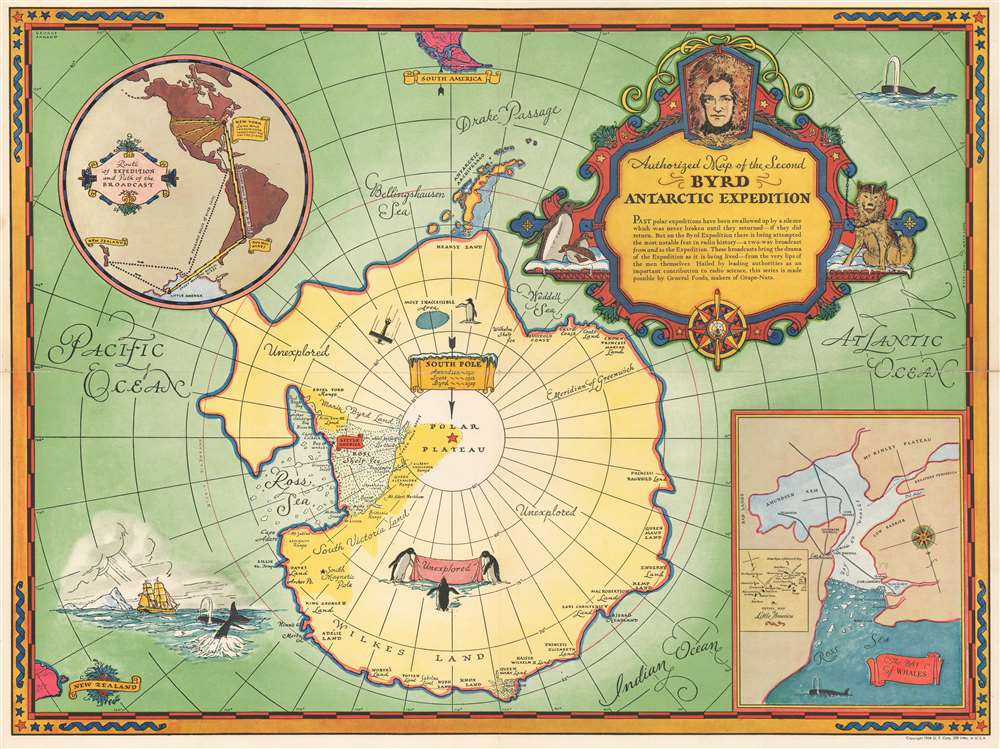
Authorized Map of the Second Byrd Antarctic Expedition.
sold
- Digital Map Information
- Suitable for large format printing
- File Size: 31.59 MB
- File Type: ZIP / TIFF
- ICC color profile embedded
- Delivered instantly via download link
This is a fascinating 1934 George Annand pictorial map of Antarctica celebrating the second Antarctic expedition of Rear Admiral Richard E. Byrd. It beautifully illustrates the South Polar Region, including the southern tip of South America and the eastern tip of New Zealand. Explored regions of Antarctica are identified along the coast, especially near the Ross Sea. Unexplored regions are also labeled. The title cartouche is adorned with a sled dog, a compass rose, penguins, and the portrait of the man himself Richard Evelyn Byrd. A note below the title reads, 'Past polar expeditions have been swallowed up by a silence which was never broken until they returned--if they did return. But on the Byrd Expedition there is being attempted the most notable feat in radio history--a two-way broadcast of the Expedition as it is being lived--from the very lips of the men themselves. Hailed by leading authorities as an important contribution to radio science, this series is made possible by General Foods, makers of Grape-Nuts'. Two insets, on the top left and bottom right quadrants respectively, detail the 'Route of Expedition and Path of the Broadcast', and 'The Bay of Whales'. A detail map of Little America (the expedition base camp on Ross Ice Shelf) is included within the inset of the Bay of Whales. Other illustrations of whales, penguins, ships, and airplanes, among other things, are included throughout.
A banner over the South Pole indicates the previous expeditions of Amundsen in 1911, Scott in 1912 and Byrd's first expedition in 1929. The second Byrd expedition took place in 1934, and it was during this second expedition that Byrd spent five cold months alone at Advance Base and almost died. He would later describe his ordeal in his autobiography Alone. (more details)
A banner over the South Pole indicates the previous expeditions of Amundsen in 1911, Scott in 1912 and Byrd's first expedition in 1929. The second Byrd expedition took place in 1934, and it was during this second expedition that Byrd spent five cold months alone at Advance Base and almost died. He would later describe his ordeal in his autobiography Alone. (more details)
Includes White Plains and Tarrytown.
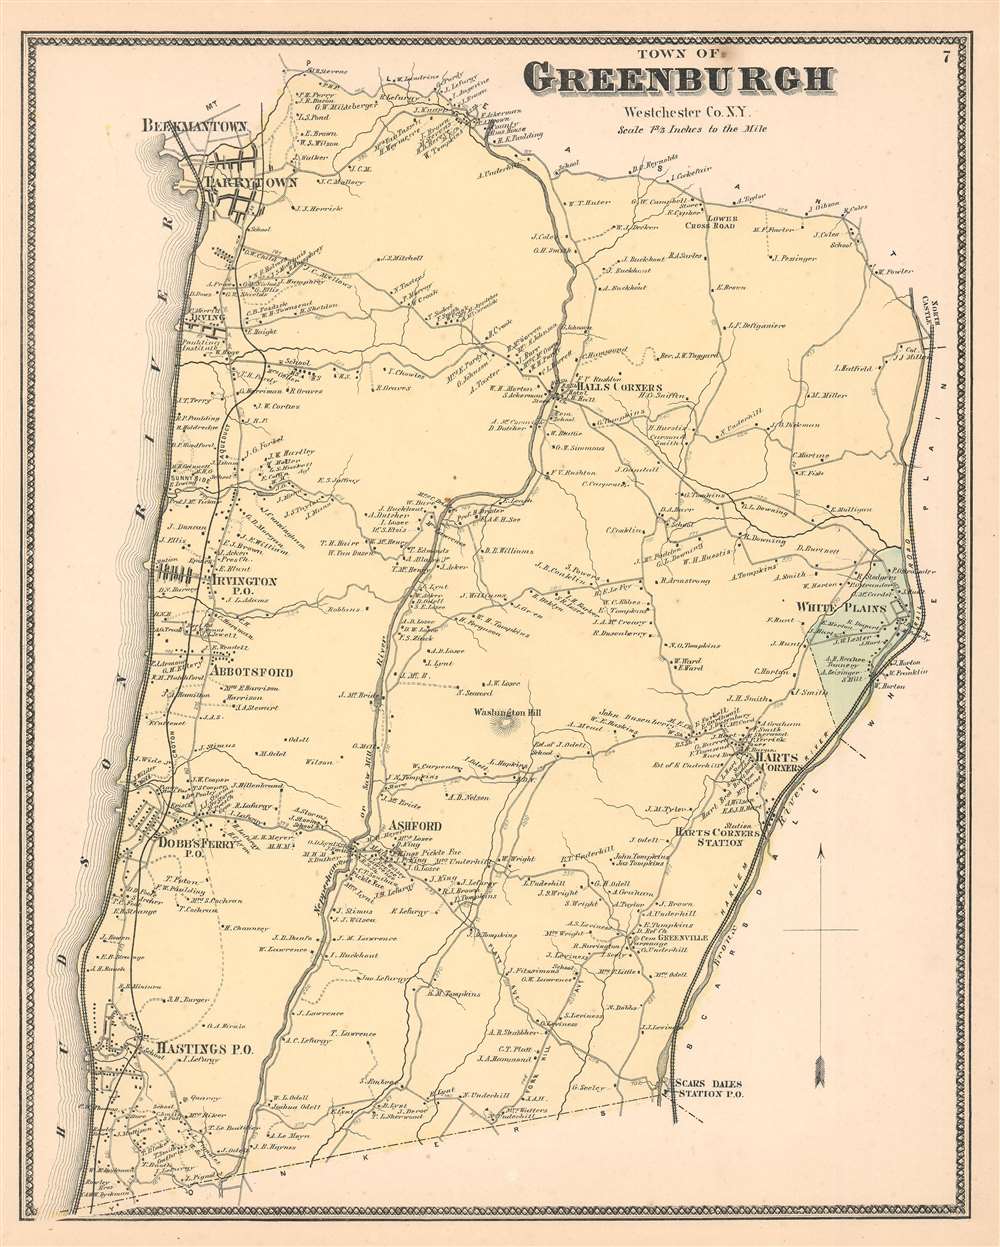
Greenburgh Westchester Co. N.Y.
sold
- Digital Map Information
- Suitable for large format printing
- File Size: 9.37 MB
- File Type: ZIP / TIFF
- ICC color profile embedded
- Delivered instantly via download link
This is the scarce Greenburgh sheet from Beers' 1867 Atlas of Westchester County, New York. When this map was produced 'Greenburgh' consisted of what is today the central Westchester County. Includes White Plains, Scarsdale, Hastings, Dobbs Ferry, Abbotsford, Irvington, Irving, Hall's Corners, Ashford, and other communities between the Harlem River and the Hudson River. Indicates the Croton Aqueducts, the Saw Mill River, and the Sprain Brook. The extraordinary detail of this map, down to individual households with family names, make it a fascinating study for the family researcher or historian. (more details)
Includes extensive field-annotations relating to action during the Indian Mutiny of 1857.
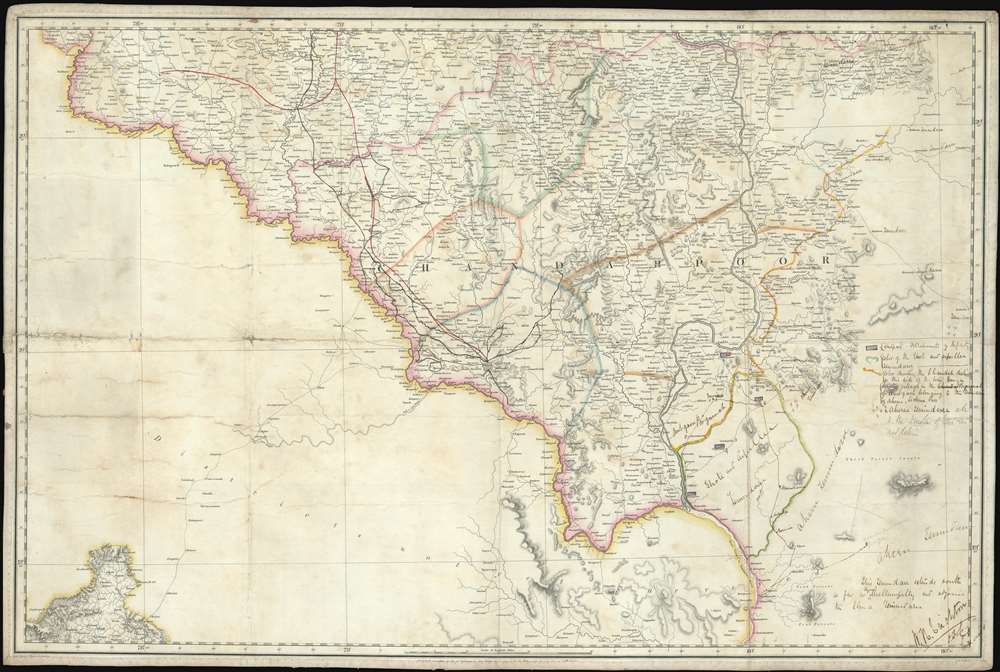
[Chandahpoor}
sold
- Digital Map Information
- Suitable for large format printing
- File Size: 41.08 MB
- File Type: ZIP / TIFF
- ICC color profile embedded
- Delivered instantly via download link
An extraordinary find, this 1856 map of the Chandrapur (Nagpur Division) is a relic of the Atlas of India, one of the East India Company's most ambitious projects, with unique manuscript annotations associated with the 1857 Indian Rebellion / Indian Mutiny. The map covers the Nagpur Division of Maharashtra, from the intersection of division of the Pranhita into the Wardah and Wainganga Rivers, about 30° N latitude, to about 45°N and from about 77.5° East meridian to about 80° East, including part of Maharashtra and the Deccan Plateau. Extensive annotations describe action under Captain W. H. Crichton relating to the suppression of a regional offshoot of the 1856 Indian Mutiny. As such this map represents unique primary source material for one of the most significant events in Indian history. (more details)
The celebrated and extremely rare 'Sarajevo Survival Map'.

1992 1993 Sarajevo 1994 1995.
sold
This is a 1996 FAMA pictorial map of Sarajevo, Bosnia and Herzegovina, during the Siege of Sarajevo. An internationally celebrated piece that is known as the 'Sarajevo Survival Map', the map depicts the city, which sits in the valley of the Miljacka River, encircled by artillery pieces and tanks all positioned on the high ground surrounding the city. 260 tanks, 120 mortars, and weapons of smaller calibers, encircled the city from April 5, 1992 until February 29, 1996, a total of 1,425 days, making it the longest siege of a capital city in the history of modern warfare. (more details)
The First Map Specifically of the Catskill Mountains

Map of the Catskill Mountains. Surveyed by A. Guyot. Drawn by Ernest Sandoz. 1880.
sold
- Digital Map Information
- Suitable for large format printing
- File Size: 28.54 MB
- File Type: ZIP / TIFF
- ICC color profile embedded
- Delivered instantly via download link
This is Arnold Guyot's 1879 map of the Catskill Mountains. It is the only early map to focus specifically on the range, and the very first to accurately depict the region, and provide a useful tool for traveling it. The far-ranging Swiss geologist was an inveterate trekker, and his surveys of not only the Catskills but also the lion's share of the Appalachian mountain range were executed personally, on foot. His map provides the elevation above sea level for virtually every peak shown on the map. Prior to his surveys, misconceptions about the Catskills abounded. For example, 'High Peak' had been so named based upon the assumption that it was the highest in the range: Guyot's survey took him far deeper into the mountains than prior surveys, however, and his cataloguing of the less-accessible mountains ranks High Peak only twenty third. Guyot, as he did in his other maps of the Appalachians, resolved epidemic disagreements about place names by relying on the terminology used by the denizens of the region he was mapping - diverging from this discipline on rare occasions where clarity in language called for it (for example, swapping Round Top with High Peak to reflect the reality that Round Top was the higher of the two.) (more details)
Describing the Northern Theatre of the Second Boer War
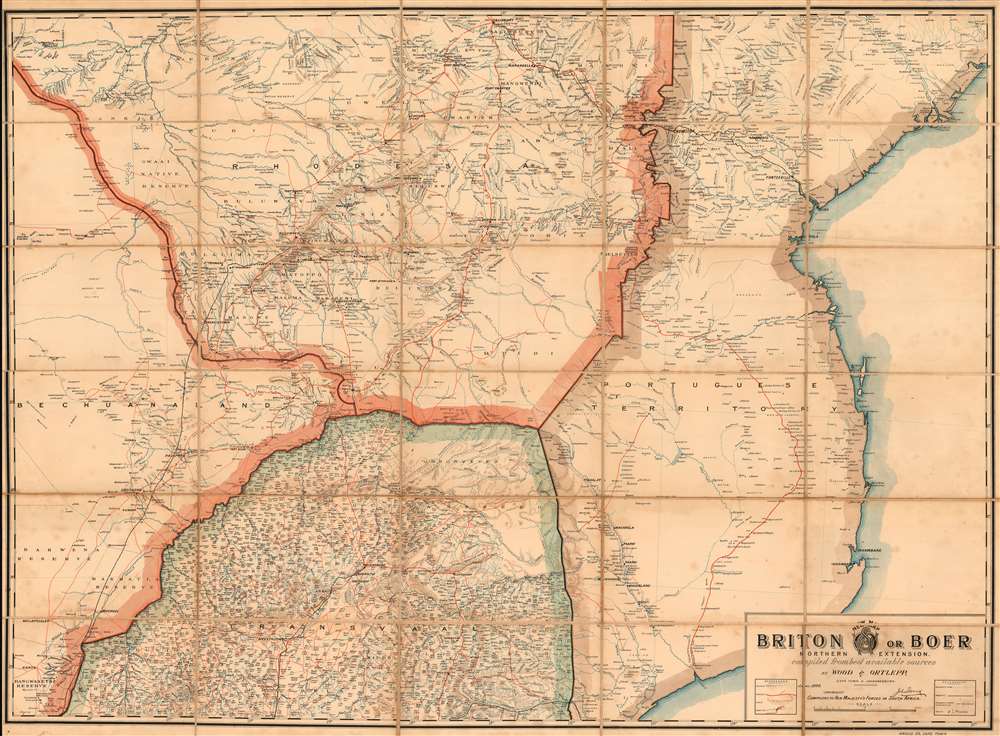
New Map: Briton or Boer Northern Extension. Compiled From Best Available Sources.
sold
- Digital Map Information
- Suitable for large format printing
- File Size: 51.55 MB
- File Type: ZIP / TIFF
- ICC color profile embedded
- Delivered instantly via download link
This is Wood and Ortlepp's 1900 map of Northern South Africa, southern Zimbabwe, Mozambique and Botswana, called 'New Map: Briton or Boer. Northern Extension.' The map shows the northern theatre of the Second Boer War, and was produced while the conflict was under way. The map focuses on the Northern Transvaal southern Rhodesia, Bechuanaland and the Portuguese Territory: what is now northern South Africa, southern Zimbabwe and Mozambique, and Botswana. Though the war's few set battles took place south of Pretoria, this was Boer territory during the later stages of the conflict. Pietersburg, for example, would not be occupied by the British until April of 1901. The superabundance of Boer place names throughout the Transvaal portion of the map, and the paucity of railways and telegraph lines, attest to the extent to which this was 'enemy territory' for the British. (more details)
A French map published during the Crimean War focusing on the effected areas.
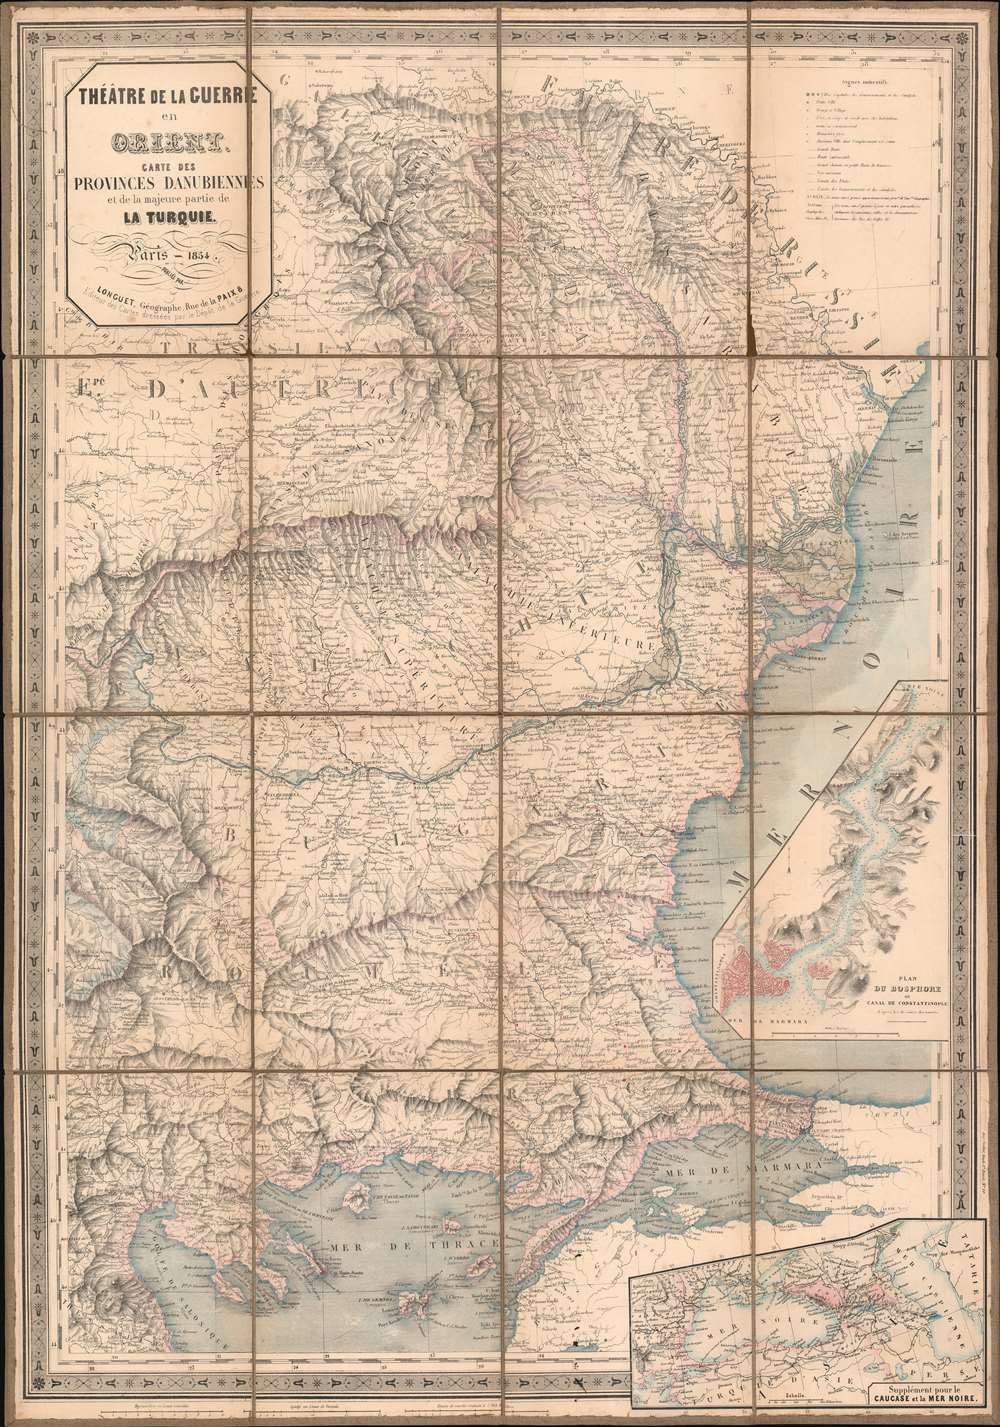
Théâtre de la Guerre en Orient. Carte des Provinces Danubiennes et de la majeure partie de la Turquie.
$950.00
Acquire
- Digital Map Information
- Suitable for large format printing
- DPI: 600
- File Size: 58.03 MB
- File Type: ZIP / TIFF
- ICC color profile embedded
- Delivered instantly via download link
This is an 1854 Longuet map of the eastern Balkans and the Black Sea. The map depicts the region from Transylvania and Thessaly to Odessa and from the Dnister (Dniester) River to Lemnos. Published in the middle of the war, areas occupied by the Russians at the beginning of the war by the Russian Empire (Wallachia and Moldavia) are highlighted, allowing the audience back in France a better understanding of where their army had been committed.
Highly detailed, myriad cities, towns, and villages are labeled, including Odessa, Istanbul/Constantinople, Salonica, and Gallipoli. Three different grades of roads are illustrated, with different notations used to differentiate between them. An inset map situated along the right border details the Bosporus from the Sea of Marmara and Constantinople/Istanbul to the Black sea. Depth soundings are indicated throughout the strait, and the city is highlighted by red shading. A second inset, located in the lower right corner, expands the breadth of the map and situates it regionally, stretching from the Balkans to the Caspian Sea. (more details)
Highly detailed, myriad cities, towns, and villages are labeled, including Odessa, Istanbul/Constantinople, Salonica, and Gallipoli. Three different grades of roads are illustrated, with different notations used to differentiate between them. An inset map situated along the right border details the Bosporus from the Sea of Marmara and Constantinople/Istanbul to the Black sea. Depth soundings are indicated throughout the strait, and the city is highlighted by red shading. A second inset, located in the lower right corner, expands the breadth of the map and situates it regionally, stretching from the Balkans to the Caspian Sea. (more details)