
Peters, Norris (sold)

Norris Peters (c. 1834 – July 15, 1889) was a Washington D.C. based photo-lithographer active in the late 18th and early 19th century whom Scientific American called 'one of Washington's most eccentric and mysterious figures.' Peters was born and educated in Pennsylvania. He relocated as a young man to Washington D.C. where he took work as an examiner for the United States Patent Office. During his work with the patent office he became fascinated with the emergent process of photolithography. In 1869 Peters secured substantial venture capital of about 100,000 USD from an unknown investor and founded The Norris Peters Company at 458 Pennsylvania Avenue. Their printing offices have been described as 'unequaled in this or any other country.' From these offices Peters pioneered the development of American photo-lithography. For nearly a generation he held a near monopoly on government photo-lithographic printing. Among their more notable contracts included numerous maps for congressional reports, maps of the U.S. Coast Survey, maps of the U.S. Geological Survey, Mexican currency for the State of Chihuahua, and the Official Gazette of the Patent Office. Peters also maintained an interesting social life and was a confidant to many of the most powerful figures in Congress. He was also a bon vivant known for being an excellent cook and hosting lavish dinners, the invitations to which were 'never declined'. Despite being socially active he never married and died a confirmed bachelor. Following Peters' death in 1889 his business was taken over by Henry Van Arsdale Parsell who administered it until his own death in 1901. The company then merged with Webb & Borcorselski, another D.C. lithography firm, and was renamed Webb & Borcorselski-Norris Peters. They continued to publish under this name well into the mid 20th century.
Enclosure and Assimilation.
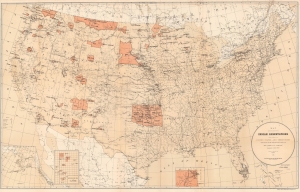
Map Showing Indian Reservations within the Limits of the United States.
sold
- Digital Map Information
- Suitable for large format printing
- File Size: 82.59 MB
- File Type: ZIP / TIFF
- ICC color profile embedded
- Delivered instantly via download link
An impressive 1885 map of the United States highlighting the location of Indian reservations, produced during the tenure of John DeWitt Clinton Atkins as Commissioner of Indian Affairs. (more details)
Tabulating Immigration in Late 19th Century New York City.
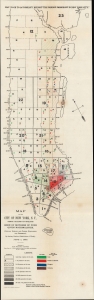
Map of the City of New York, N.Y., showing the Density of Population Born of Mothers of Four Given Nationalities, (Italian, Russian and Polish, Hungarian, and Bohemian)
sold
- Digital Map Information
- Suitable for large format printing
- File Size: 8.27 MB
- File Type: ZIP / TIFF
- ICC color profile embedded
- Delivered instantly via download link
An early work of sociological cartography, this 1890 map of New York City was prepared by Kate Holladay Claghorn and published as a supplement to the 1901 government report 'The Foreign Immigrant in New York City.' It displays the population density of four European ethnic groups in Manhattan, demonstrating their concentration in Lower Manhattan. (more details)
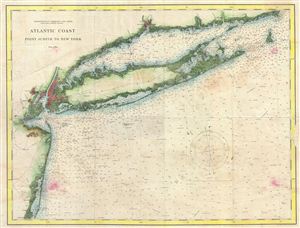
Atlantic Coast Point Judith to New York.
sold
- Digital Map Information
- Suitable for large format printing
- File Size: 18.91 MB
- File Type: ZIP / TIFF
- ICC color profile embedded
- Delivered instantly via download link
An uncommon and appealing nautical chart of New York City, Long Island, the Connecticut coastline adjacent to the Long Island Sound, and parts of New Jersey to Barnegat Bay. A beautiful example of the Coast Survey's work in this region with countless depth ... (more details)
Rare oversized map of Washington D.C. showing early electrical wiring conduits.
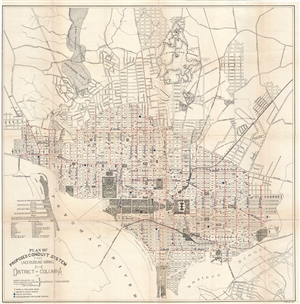
Plan of Proposed Conduit System for Underground Wiring in the District of Columbia.
sold
- Digital Map Information
- Suitable for large format printing
- File Size: 15.42 MB
- File Type: ZIP / TIFF
- ICC color profile embedded
- Delivered instantly via download link
A fascinating 1891 map of Washington D.C. illustrating electrical conduit lines. This large map covers from the Rock Creek Cemetery to Haines Point and from Georgetown to the Anacostia River. City Blocks are identified numerically. The map has been ... (more details)
Rare map showing existing and proposed Electrical Street Lights in Washington D.C. as of June o 1891.
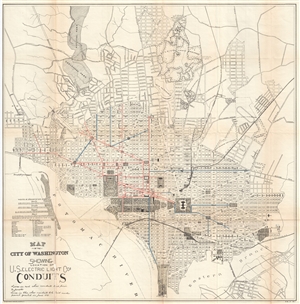
Map of the City of Washington Showing Location of U. S. Electric Light Cos. Conduits.
sold
- Digital Map Information
- Suitable for large format printing
- File Size: 16.57 MB
- File Type: ZIP / TIFF
- ICC color profile embedded
- Delivered instantly via download link
A fascinating 1891 map of Washington D.C. illustrating electrical conduit lines. This large map covers from the Rock Creek Cemetery to Haines Point and from Georgetown to the Anacostia River. City Blocks are identified numerically. The map has been ... (more details)
Rare map showing existing and proposed Telephone Lines in Washington D.C. as of June o 1891.
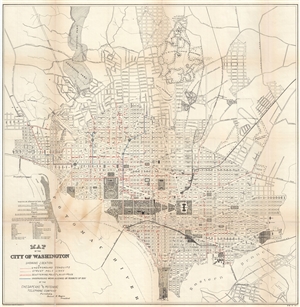
Map of the City of Washington Showing Location of Underground Conduits, Street Pole lines, Scattering Poles and Alley Poles, Underground Work allowed by Permits of 1891 of the Chesapeake and Potomac Telephone Company.
sold
- Digital Map Information
- Suitable for large format printing
- File Size: 16.51 MB
- File Type: ZIP / TIFF
- ICC color profile embedded
- Delivered instantly via download link
A fascinating 1891 map of Washington D.C. illustrating Chesapeake and Potomac Telephone Company telephone poles, lines, and conduits. This large map covers from the Rock Creek Cemetery to Haines Point and from Georgetown to the Anacostia River. City ... (more details)
Washington D.C's telegraph network.
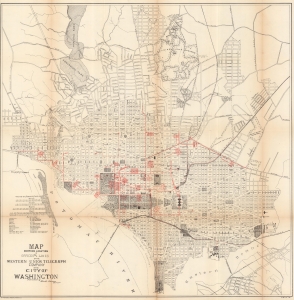
Map Showing Location of Offices and Lines of the Western Union Telegraph Company in the City of Washington.
sold
- Digital Map Information
- Suitable for large format printing
- File Size: 76.27 MB
- File Type: ZIP / TIFF
- ICC color profile embedded
- Delivered instantly via download link
This is a fascinating 1891 Norris Peters city map of Washington D.C. detailing Western Union Telegraph lines and offices. (more details)
Illustrates the ephemeral period when there was an Oklahoma Territory and an Indian Territory vying for statehood.
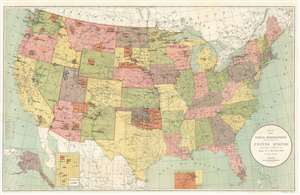
Map Showing Indian Reservations Within the Limits of the United States. Compiled Under the Direction of the Hon. T.J. Morgan.
sold
- Digital Map Information
- Suitable for large format printing
- File Size: 37.41 MB
- File Type: ZIP / TIFF
- ICC color profile embedded
- Delivered instantly via download link
This is an 1892 Thomas Jefferson Morgan map of the United States showing Indian reservations. The map depicts the country from the Pacific Ocean to the Atlantic Ocean and from Canada to Mexico and the Gulf of Mexico. Indian reservations throughout the country are highlighted in orange and labeled in block lettering. Indian boarding schools, day schools, and contract schools throughout the U.S. are identified by different symbols which correspond to a key situated along the left border. The states are all illustrated, labeled, and shaded different colors to allow for easy differentiation. Cities and towns are labeled as well, as are railroads throughout the country. Yellowstone National Park, established in 1872, is also identified. Three insets are situated along the bottom border that illustrate Alaska, the Mission Indian Reservation in California, and the northeastern corner of the Indian Territory. (more details)
A Buffalo Soldier regiment.
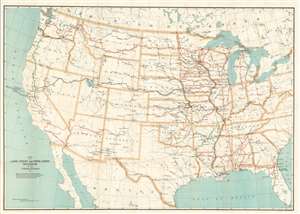
Map of Land-Grant and Bond-Aided Railroads of the United States.
sold
- Digital Map Information
- Suitable for large format printing
- Full resolution TIFF file
- ICC color profile embedded
- Delivered instantly via download link
This is an 1892 U.S. Army Quartermaster General railroad map of the United States owned by Army Colonel David Dougall Van Valzah while he was in command of a Buffalo Soldier infantry regiment in New Mexico. The map depicts most of the continental United States from the Pacific Ocean to Maryland, Virginia, Pennsylvania, and New York and from Canada to Mexico. Issued with General Orders, No. 77 in 1892, black, green, and red lines trace land-grant and bond-aided railroads in the western United States. General Orders No. 77 outlined military procedures for 'compensating' the railroads for 'transporting United States troops and property.' The order, which the map accompanied, specified exact rates each of the concerned railroads was owed. The Adjutant General explained the map's inclusion in this way
As an aid to a clear and convenient understanding of the routes, termini, etc., of the several railroads to which this order refers, and as a matter of ready reference, when the use of these roads is involved in the issue of transportation, a map of the land-grant and bond-aided roads is published herewith.(more details)
Highlighting Indian reservations across the United States.
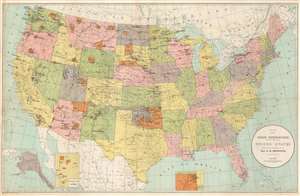
Map Showing Indian Reservations within the Limits of the United States.
sold
- Digital Map Information
- Suitable for large format printing
- File Size: 26.51 MB
- File Type: ZIP / TIFF
- ICC color profile embedded
- Delivered instantly via download link
This is an 1896 Daniel M. Browning and Office of Indian Affairs map of the United States highlighting Indian reservations. Reservations, the vast majority of which are located west of the Mississippi River, appear in orange. Black block letters identify each reservation. Red stars, triangles, squares, and circles mark non-reservation schools, day schools, boarding schools, and contract schools, respectively. (more details)
The 15th convention of the Young People's Society of Christian Endeavor.
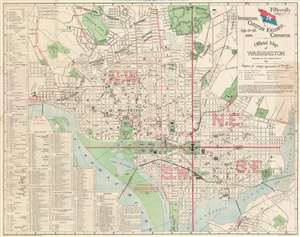
Official Map of Washington. Fifteenth International Christian Endeavor Convention. July 8 - 13, 1896.
sold
- Digital Map Information
- Suitable for large format printing
- File Size: 20.82 MB
- File Type: ZIP / TIFF
- ICC color profile embedded
- Delivered instantly via download link
This is an 1896 Young People's Society of Christian Endeavor city plan or map of Washington, D.C. Published for the Fifteenth International Christian Endeavor Convention, over 260 locations in Washington, D.C. and Anacostia are numerically identified and correspond to a detailed index situated along the map's right border. The meeting places for the convention, three of which were 10,000 person tents erected by Christian Endeavor, appear at the top of the index and are followed by churches (divided by denomination), hotels, public buildings (which include museums and government buildings), foreign legations, educational institutions, monuments, and parks. Large black lettering highlights the National Mall and the White Lot, which is known as The Ellipse today. The three large tents, called Williston, Endeavor, and Washington, are marked by large red dots. Major railways and transfer stations are illustrated in red and differentiated by a coding schema. This key is situated just below the title in the upper right. (more details)
Spanish-American War map of Manila.
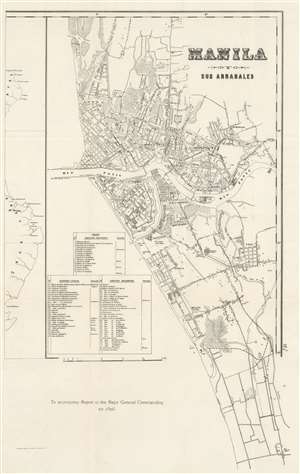
Manila y Sus Arrabales. To accompany Report of Major General Commanding for 1898.
sold
- Digital Map Information
- Suitable for large format printing
- File Size: 12.54 MB
- File Type: ZIP / TIFF
- ICC color profile embedded
- Delivered instantly via download link
This is an 1898 Norris Peters edition of a Francisco J. de Gamoneda map or city plan of Manila, the Philippines and was printed to accompany the report of the Major General commanding in the Philippines, who was also the military governor. The map depicts the city from the Barrio de S. Nicolas to Pasay and from the Bocana de Vistas to Pasay. The Pasig River divides the city in two, just as it does today. Highly detailed, roads, neighborhoods and civic sites, such as cemeteries, are labeled. There is an index along the left margin which lists seventy-seven military, civil, and religious sites around the city. (more details)
Spanish-American War map of Manila.
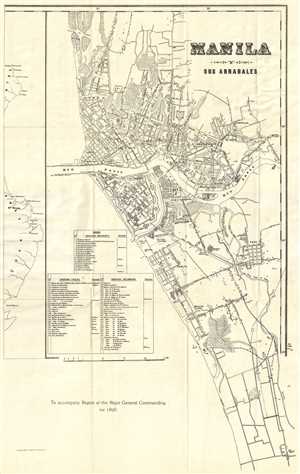
Manila y Sus Arrabales. To accompany Report of Major General Commanding for 1898.
sold
- Digital Map Information
- Suitable for large format printing
- File Size: 5.08 MB
- File Type: ZIP / TIFF
- ICC color profile embedded
- Delivered instantly via download link
This is an 1898 Norris Peters edition of a Francisco J. de Gamoneda map or city plan of Manila, the Philippines and was printed to accompany the report of the Major General commanding in the Philippines, who was also the military governor. The map depicts the city from the Barrio de S. Nicolas to Pasay and from the Bocana de Vistas to Pasay. The Pasig River divides the city in two, just as it does today. Highly detailed, roads, neighborhoods and civic sites, such as cemeteries, are labeled. There is an index along the left margin which lists seventy-seven military, civil, and religious sites around the city. (more details)
Shocking map of Washington, D.C. depicting fatal cases of consumption.
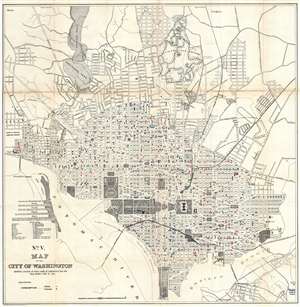
No. V. Map of the City of Washington Showing Location of Fatal Cases of Consumption for the Year Ended June 30, 1901.
sold
- Digital Map Information
- Suitable for large format printing
- File Size: 16.94 MB
- File Type: ZIP / TIFF
- ICC color profile embedded
- Delivered instantly via download link
A fascinating 1901 Norris Peters map of Washington D.C. illustrating fatal cases of consumption (tuberculosis). This large map covers from the Rock Creek Cemetery to Haines Point and from Georgetown to the Anacostia River. City Blocks are identified ... (more details)
Fascinating map of Washington, D.C. depicting fatal diseases.
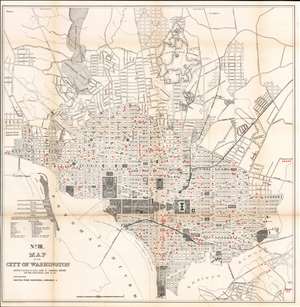
No. III. Map of the City of Washington Showing Location of Fatal Cases of Diarrhoeal Diseases for the Year Ended June 30, 1901.
sold
- Digital Map Information
- Suitable for large format printing
- File Size: 37.09 MB
- File Type: ZIP / TIFF
- ICC color profile embedded
- Delivered instantly via download link
This is a fascinating and rare 1901 Norris Peters map of Washington D.C. illustrating fatal cases of diarrheal diseases. This large map covers from the Rock Creek Cemetery to Haines Point and from Georgetown to the Anacostia River. City blocks are identified numerically. Red overprinted squares mark fatal cases of diarrheal diseases throughout the city. (more details)
Compelling map of Washington, D.C. depicting fatal cases of diphtheria and scarlet fever.
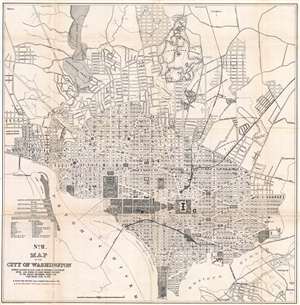
No. II. Map of the City of Washington Showing Location of Fatal Cases of Diphtheria and Scarlet Fever, also Number of Cases Thereof Reported to the Health Department During the Year Ended June 30, 1901.
sold
- Digital Map Information
- Suitable for large format printing
- File Size: 18.19 MB
- File Type: ZIP / TIFF
- ICC color profile embedded
- Delivered instantly via download link
A fascinating 1901 Norris Peters map of Washington D.C. illustrating fatal cases of diphtheria and scarlet fever, as well as the number of cases reported. This large map covers from the Rock Creek Cemetery to Haines Point and from Georgetown to the ... (more details)
Disease map of Washington, D.C.
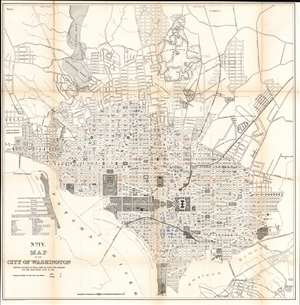
No. IV. Map of the City of Washington Showing Location of Fatal Cases of Lung Diseases for the Year Ended June 30, 1901.
sold
- Digital Map Information
- Suitable for large format printing
- File Size: 35.77 MB
- File Type: ZIP / TIFF
- ICC color profile embedded
- Delivered instantly via download link
A fascinating and uncommon 1901 Norris Peters map of Washington D.C. illustrating fatal cases of lung disease, including pneumonia, bronchitis, and other acute lung disorders. This large map depicts the city from the Rock Creek Cemetery to Haines Point and from Georgetown to the Anacostia River. City blocks are identified numerically. Overprinting with symbols marks fatal cases of these lung diseases throughout the city. Curiously, these cases have been divided by 'race', a red 'X' depicts a fatal 'white' case, and a black 'X' depicts a fatal 'colored' case. Cases are scattered throughout the city, with some appearing as lone cases, others in clusters. (more details)
Fascinating map of Washington, D.C. depicting fatal cases of typhoid fever and malaria.
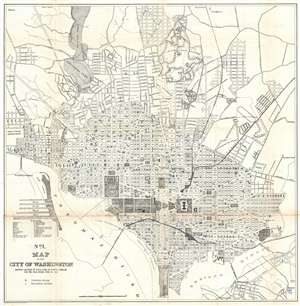
No. I. Map of the City of Washington Showing Location of Fatal Cases of Zymotic Diseases for the Year Ended June 30, 1901.
sold
- Digital Map Information
- Suitable for large format printing
- File Size: 16.76 MB
- File Type: ZIP / TIFF
- ICC color profile embedded
- Delivered instantly via download link
A fascinating 1901 Norris Peters map of Washington D.C. illustrating fatal cases of zymotic diseases, 'typhoid fever' and 'malarial fever'. This large map covers from the Rock Creek Cemetery to Haines Point and from Georgetown to the Anacostia ... (more details)
The U.S. becomes a Pacific power.
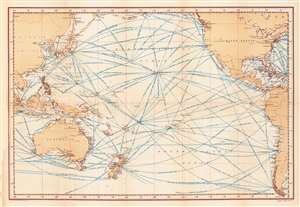
Distance Map of the Pacific Ocean... showing tracks of full-powered steam vessels, with the shortest routes between points, in nautical miles.
sold
- Digital Map Information
- Suitable for large format printing
- File Size: 48.67 MB
- File Type: ZIP / TIFF
- ICC color profile embedded
- Delivered instantly via download link
This is a scarce 1902 Norris Peters map detailing steamship routes across the Pacific. It was produced when the United States was consolidating its control of the Philippines, Hawaii, Guam, and other Pacific possessions in the wake of the Spanish-American War, a process which the map was designed to facilitate. (more details)
Last Days of the Indian Territory.
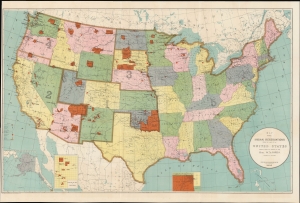
Map Showing Indian Reservations within the Limits of the United States.
sold
- Digital Map Information
- Suitable for large format printing
- File Size: 35.01 MB
- File Type: ZIP / TIFF
- ICC color profile embedded
- Delivered instantly via download link
An impressive large-format 1904 map of the United States highlighting the location of Indian reservations, produced during the tenure of William Arthur Jones as Commissioner of Indian Affairs. (more details)
Flood Relief and Levee Breaches.
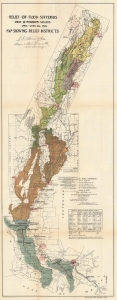
Relief of Flood Sufferers Ohio and Mississippi Valleys April - June 1912 Map Showing Relief Districts.
sold
- Digital Map Information
- Suitable for large format printing
- File Size: 22.73 MB
- File Type: ZIP / TIFF
- ICC color profile embedded
- Delivered instantly via download link
This is a 1913 Norris Peters map of relief zones created to help rebuild after the 1912 Mississippi River Flood. One of the worst Mississippi River floods in recorded history, the flood caused nearly $100 million in damage and lasted 83 days. The 1912 flood was also the first Mississippi River flood to be photographed. (more details)
One of the worst Mississippi River floods in history.
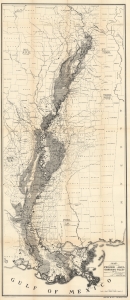
Map Showing Flooded Area Mississippi Valley 1912. Based on U.S.A. Engineer Maps.
sold
- Digital Map Information
- Suitable for large format printing
- File Size: 30.63 MB
- File Type: ZIP / TIFF
- ICC color profile embedded
- Delivered instantly via download link
This is a 1913 Norris Peters map of the 1912 Mississippi River Flood. One of the worst Mississippi River floods in recorded history, the flood caused nearly $100 million in damage and lasted 83 days. The 1912 flood was also the first Mississippi River flood to be photographed. (more details)
Key West, Poised to Take Off.
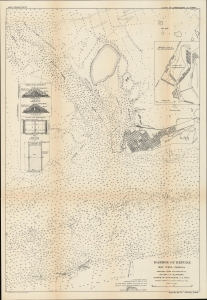
Harbor of Refuge Key West, Florida... Traced from U. S. Coast Chart No 584.
sold
- Digital Map Information
- Suitable for large format printing
- File Size: 40.54 MB
- File Type: ZIP / TIFF
- ICC color profile embedded
- Delivered instantly via download link
A fascinating nautical map, including a city plan of Key West, Florida, and technical schematics of a breakwater, produced in 1913 by Major J. R. Slattery of the U.S. Army Corps of Engineers. It displays the city and island at the start of a boom, brought about by the completion of the Florida East Coast Railway. (more details)
Basis for the Growth of Tampa Bay.
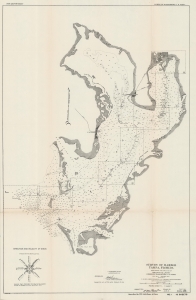
Survey of Harbor Tampa, Florida Index Sheet 1.
sold
- Digital Map Information
- Suitable for large format printing
- File Size: 42.18 MB
- File Type: ZIP / TIFF
- ICC color profile embedded
- Delivered instantly via download link
A 1915 nautical map of Tampa Bay produced by the U.S. Army Corps of Engineers for a Congressional report. The Corps had undertaken multiple projects in this region in the preceding years which allowed Tampa to ship its economic products (phosphate and cigars, primarily) to distant ports, a major factor in the city's growth. (more details)
Channeling Water and Wealth to Tampa.
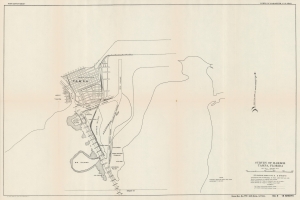
Survey of Harbor Tampa, Florida Sounding Sheet No. 8.
sold
- Digital Map Information
- Suitable for large format printing
- File Size: 31.75 MB
- File Type: ZIP / TIFF
- ICC color profile embedded
- Delivered instantly via download link
A 1915 nautical chart and map of Tampa, Florida, produced by the U.S. Army Corps of Engineers. It demonstrates the dredging and widening of waterways leading to the city, which were essential to the growth of its economy, especially the shipping of phosphate and cigars which were locally produced. (more details)