
Features several smaller pictorial maps of Iran's mineral wealth, historical sites, and traditional tribal costumes.
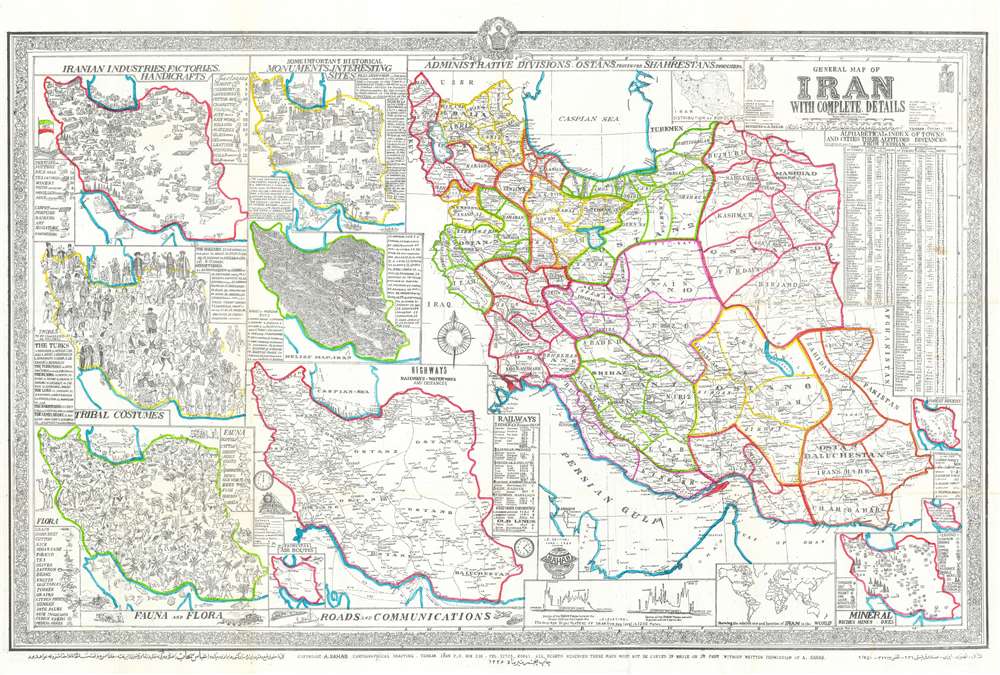
General Map of Iran with Complete Details.
sold
- Digital Map Information
- Suitable for large format printing
- File Size: 60.44 MB
- File Type: ZIP / TIFF
- ICC color profile embedded
- Delivered instantly via download link
This is a 1957 Abbas Sahab map of Iran. The map depicts Iran in full, from Iraq and Turkey to Afghanistan and Pakistan and from the Caucasus, the Caspian Sea, and Turkmenistan to the Persian Gulf and the Gulf of Oman. Using inset maps of varying size, Sahab illustrates political, cultural, historical, and economic aspects of Iran. A large political map highlighting the ostans, provinces, shahrestans, and townships within the country occupies the right half of the sheet. Each ostan is bordered in a different color, and further subdivided into provinces and other administrative districts. Many cities, towns, and villages are labeled, including Tehran, Isfahan, and Shiraz.
On the left side of the sheet, seven smaller maps of varying size illustrate different aspects of Iranian society and culture. Starting at the top left, a pictorial map traces Iranian industry and factory production using different symbols for each industry/factory/handicraft. Chemical factories, canneries, cotton gins, oil industry facilities, and other factories producing cigarettes, sugar, leather are highlighted here, as well as carpet making, perfumeries, and artists. To the right of the industrial map is a pictorial map of Iran's historical monuments and other interesting sites. Fifty-two different sites are numerically identified, illustrated in profile, and identified in the textboxes along the left and right sides. Perhaps a bit incongruously, people, presumably tourists on holiday, are illustrated in bathing suits in the Caspian Sea. Below these two maps sits a pictorial map of traditional Iranian tribal costumes that illustrates the costumes of sixty-five different tribes. Next to this map is a topographical relief map that illustrates Iran's topography, naming fifty-eight mountain peaks. Below these two maps, along the bottom border, a pictorial map depicts Iranian flora and fauna. On left side, a sub-map defines the Iranian rail network. A very small inset map in the lower left corner illustrates Iran's air routes.
Along the bottom, two different graphs depict the elevation of the Iranian plateau above sea level, providing the viewer with a better understanding of just how high most of the country sits. Another small inset map of the world is included along the bottom border and is meant to show where Iran is in relation to the rest of the world. Yet another inset map, in the lower right corner, traces the mineral wealth of Iran identifying deposits of aluminum, gold, iron, oil, salt, marble, and copper, among others. Two small inset maps situated along the right side provide general information about Iran and its forested region. The general information provided includes the area, which is 622,000 square miles, its population (18,000,000), and the number of villages (50,000). An alphabetical index of cities and towns with the altitudes and distances from Tehran is included in the upper right corner. The whole is surrounded by a pictorial border. (more details)
On the left side of the sheet, seven smaller maps of varying size illustrate different aspects of Iranian society and culture. Starting at the top left, a pictorial map traces Iranian industry and factory production using different symbols for each industry/factory/handicraft. Chemical factories, canneries, cotton gins, oil industry facilities, and other factories producing cigarettes, sugar, leather are highlighted here, as well as carpet making, perfumeries, and artists. To the right of the industrial map is a pictorial map of Iran's historical monuments and other interesting sites. Fifty-two different sites are numerically identified, illustrated in profile, and identified in the textboxes along the left and right sides. Perhaps a bit incongruously, people, presumably tourists on holiday, are illustrated in bathing suits in the Caspian Sea. Below these two maps sits a pictorial map of traditional Iranian tribal costumes that illustrates the costumes of sixty-five different tribes. Next to this map is a topographical relief map that illustrates Iran's topography, naming fifty-eight mountain peaks. Below these two maps, along the bottom border, a pictorial map depicts Iranian flora and fauna. On left side, a sub-map defines the Iranian rail network. A very small inset map in the lower left corner illustrates Iran's air routes.
Along the bottom, two different graphs depict the elevation of the Iranian plateau above sea level, providing the viewer with a better understanding of just how high most of the country sits. Another small inset map of the world is included along the bottom border and is meant to show where Iran is in relation to the rest of the world. Yet another inset map, in the lower right corner, traces the mineral wealth of Iran identifying deposits of aluminum, gold, iron, oil, salt, marble, and copper, among others. Two small inset maps situated along the right side provide general information about Iran and its forested region. The general information provided includes the area, which is 622,000 square miles, its population (18,000,000), and the number of villages (50,000). An alphabetical index of cities and towns with the altitudes and distances from Tehran is included in the upper right corner. The whole is surrounded by a pictorial border. (more details)
A Vietnamese map of Saigon published during President Johnson's escalation of the Vietnam War.
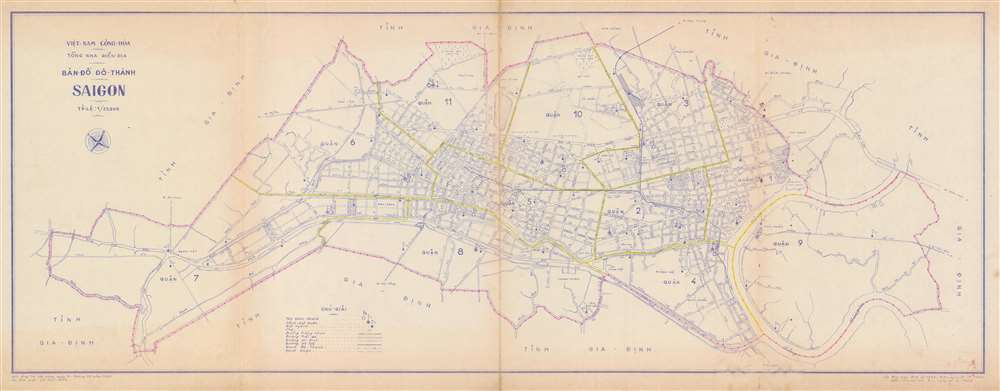
Map of the City Saigon. / Bản Đồ Dô Thành Saigon.
sold
- Digital Map Information
- Suitable for large format printing
- File Size: 15.65 MB
- File Type: ZIP / TIFF
- ICC color profile embedded
- Delivered instantly via download link
This is a 1966 city map or plan of Saigon, South Vietnam by the Vietnamese artist Lê thái Bình. The map depicts the city from District 7 to District 9 and from District 10 to District 8 and District 4. Streets throughout the city are labeled, and differences are noted between paved roads (two solid lines), stone roads (one solid and one dashed line), and planned roads (two dashed lines). Railroads are illustrated by thick solid lines. The city limits are highlighted by the pink lines which trace the series of three dots and a cross that denote the city limits. The yellow lines throughout the city mark the boundaries between the districts. District courts are marked by the flags with a stripe on them and police stations by the solid circle inscribed in an empty one. The Saigon River is illustrated on the map's right side. (more details)
Daytona Beach, 'The World's Most Famous Beach'.
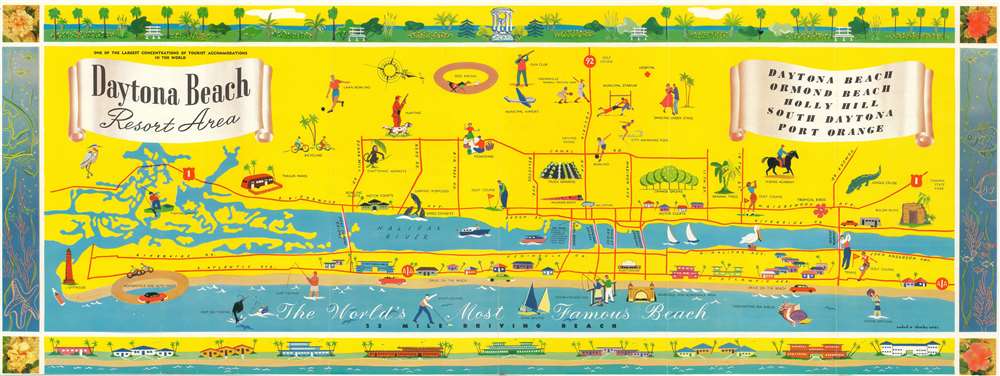
Daytona Beach Resort Area.
sold
- Digital Map Information
- Suitable for large format printing
- File Size: 19.21 MB
- File Type: ZIP / TIFF
- ICC color profile embedded
- Delivered instantly via download link
Created by Wadad and Charles Corsi, this is a c. 1956 pictorial map of Daytona Beach, Florida. Promoted as 'The World's Most Famous Beach', the map depicts Daytona Beach from Ponce de Leon Inlet to Tomoka State Park. Activities that cater to tourists, such as horseback riding, bicycling, golf, and bathing in the ocean are illustrated by vignettes, Tourists are not the only ones this map is trying to reach, since the city swimming pool, bowling alleys, dances, and the municipal stadium are also highlighted. Major roads are marked by solid red lines, which include the five bridges spanning the Halifax River, which separates Daytona Beach from the peninsula. The whole is surrounded by a pictorial border made up of picturesque gardens, fish and other sea creatures, and beach-front homes. (more details)
A tourist map created the same year as the release of a quasi-pronographic film lauched Bali into the minds of tourists worldwide.
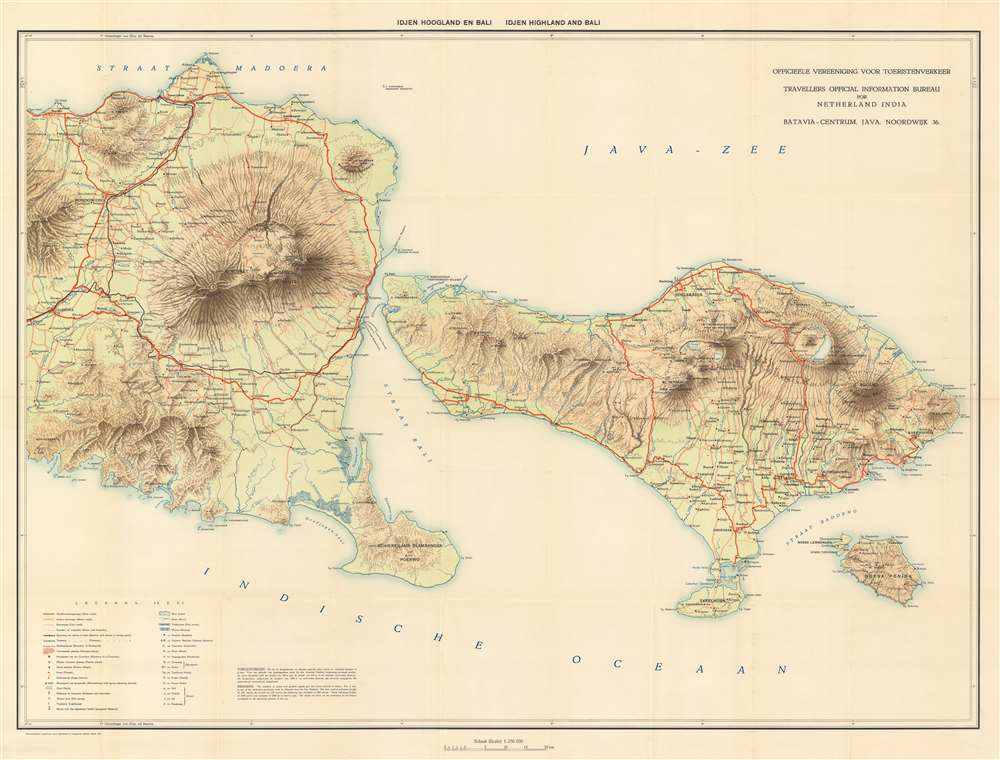
Idjen Hoogland en Bali. Idjen Highland and Bali.
sold
- Digital Map Information
- Suitable for large format printing
- File Size: 50.11 MB
- File Type: ZIP / TIFF
- ICC color profile embedded
- Delivered instantly via download link
This is a 1932 Travellers Official Information Bureau for Netherland India bilingual Dutch and English map of eastern Java and Bali in Indonesia. Bali, recognized as one of the world's most sought-after tourist destinations, is situated on the right of the map, depicts the region from Mount Argopuro to the Lombok Strait and from the Bali Sea to the Indian Ocean. Towns and villages throughout the islands are labeled, including Bondowoso on Java and Denpasar, the provincial capital. Mount Raung, Ijen, Baluran, and the Wurung Crater are all illustrated on Java and Mount Batur and Mount Agung on Bali, providing incredible insight into the terrain of these two islands. Mount Agung on Bali is an active volcano and is rated as one of the most likely sites for a massive eruption in the next century. Roads of varying types are also noted, including major roads which are highlighted by thick solid red lines, motor roads, cart roads, and footpaths, which are marked by progressively fainter notations. A key situated in the lower left corner notes that native villages, temples, and sugar factories are among the locations noted. (more details)
Gorgeous example of Black's mountains and rivers chart.

Physical Geography.
sold
- Digital Map Information
- Suitable for large format printing
- DPI: 600
- File Size: 12.67 MB
- File Type: ZIP / TIFF
- ICC color profile embedded
- Delivered instantly via download link
A fine example of Adam and Charles Black's 1840 comparative mountains and rivers of the world chart. Charts of this kind were first introduced in England around 1823 and became a common feature in atlases throughout the 19th century. The present example is admired as one of the more attractive British examples of the style. (more details)
Highlights Manhattan's many theatres, including the New Amsterdam and Lyric Theatres.

Hagstrom's Map of New York Theatres, Hotels, Shopping District.
sold
- Digital Map Information
- Suitable for large format printing
- File Size: 26.72 MB
- File Type: ZIP / TIFF
- ICC color profile embedded
- Delivered instantly via download link
This is a c. 1940 Hagstrom map of Midtown Manhattan highlighting the Theatre District and its many theatres. The map depicts the city from Eighth Avenue to Lexington Avenue and from West 61st Street, Central Park, and East 61st Street to 22nd Street. Although numerous buildings are illustrated, not all the city blocks are filled. Banks, churches, clubs, department stores, hotels, nightclubs, office buildings, public buildings, train stations, and theatres are shaded using various colors to allow for easy differentiation and identification. An index, situated along the map's right side, lists the identified locations, offers a color-coding key, and notes each building's coordinates on the map. (more details)
Comical vignettes highlights activities in and around Tampa, Florida.

Points of Interest In and Around Tampa Hillsborough County Florida
sold
- Digital Map Information
- Suitable for large format printing
- File Size: 25.64 MB
- File Type: ZIP / TIFF
- ICC color profile embedded
- Delivered instantly via download link
This is a c. 1947 Tampa Chamber of Commerce city map or plan of Tampa, Florida. The map depicts the region from Tampa Bay to the Temple Terrace Golf Club and the Florida Christian College and from Fowler Street and the Tampa Golf and Country Club to MacDill Air Force Base. Meant to be a tourist map, pictorial vignettes populate the map and highlight area attractions and activities. Numerous golf courses are marked by men and women out on the links, as are farmer's markets, baseball stadiums, tennis courts, and beaches. Florida's celebrated orange groves also make an appearance. Other sites, that most likely are not on the average tourist's itinerary, are also illustrated, including cigar factories, a cement plant, the police pistol range, and dairy cattle. Only major streets and avenues are depicted, making this map less about getting around Tampa and more about what there is to see and do. An inset map of downtown Tampa is situated in the lower left corner details this part of the city and features vignettes of Union Station, the bus terminal, city hall, the Greater Tampa Chamber of Commerce, the University of Tampa and the American Hellenic League. (more details)
Includes an index of every city and town on a railroad line in Florida.
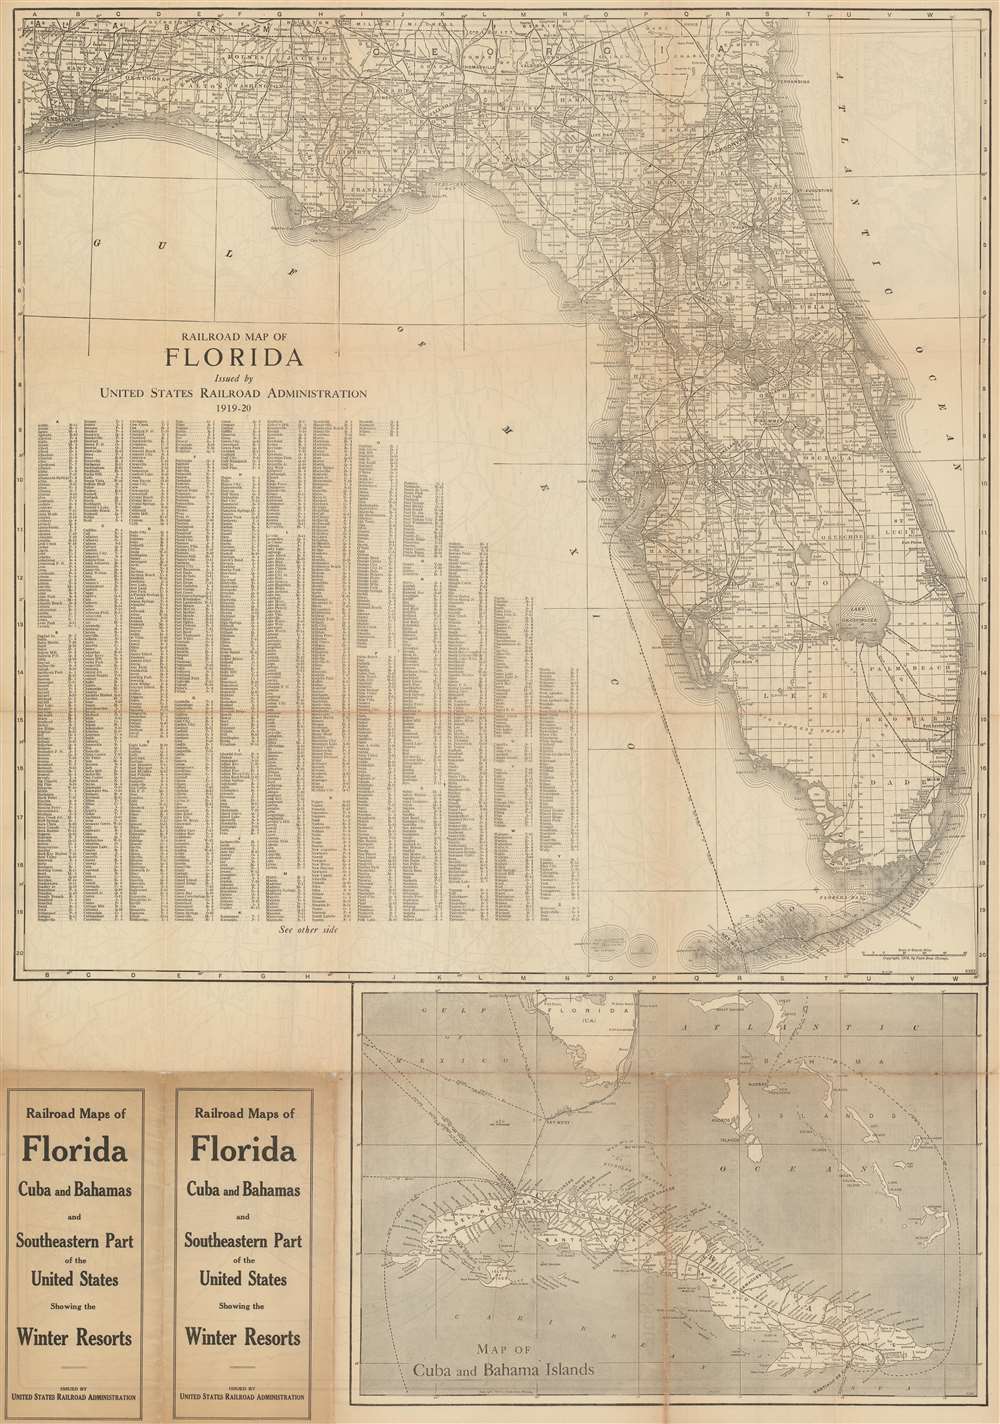
Railroad Map of Florida Issued by United States Railroad Administration 1919-20.
sold
- Digital Map Information
- Suitable for large format printing
- File Size: 58.77 MB
- File Type: ZIP / TIFF
- ICC color profile embedded
- Delivered instantly via download link
This is a 1915 Poole Brothers railroad map of Florida published by the United States Railroad Administration in 1919. The map depicts the state from Pensacola to the Atlantic Ocean and from Alabama and Georgia to Key West. Solid black lines illustrating railroad routes wind their way across Florida in every direction, connecting major cities, such as Jacksonville, Tallahassee, Tampa, Orlando, and Miami, while stopping at innumerable smaller cities and towns along the way. Every stop on every line is labeled. Counties throughout Florida are illustrated and labeled as well, as are Florida's numerous rivers and lakes. The entire state is also overlaid with the grid of the public land survey system and, allowing the viewer to precisely locate a single township anywhere in Florida. An alphabetic index of cities and towns is situated in the Gulf of Mexico and provides the grid location on the map for each locality. Below the map's bottom border a railroad map of Cuba is included that also illustrates shipping lanes between numerous Caribbean and American ports. (more details)
A comical pictorial tourist map of London.
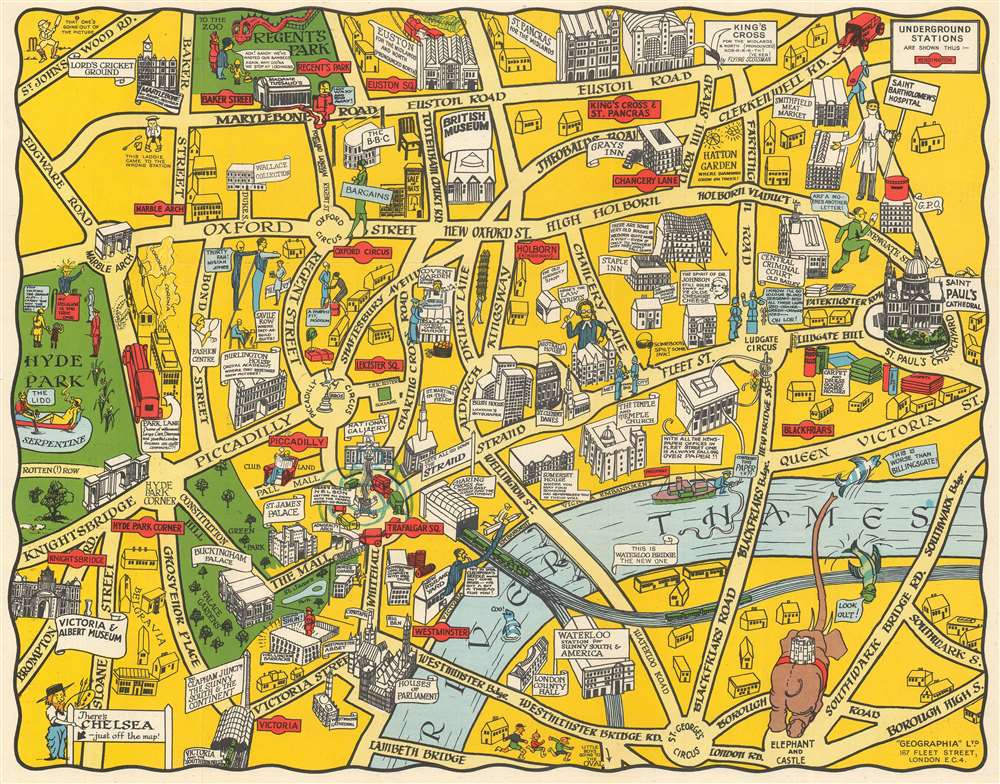
The New Pictorial Map of London.
sold
- Digital Map Information
- Suitable for large format printing
- File Size: 19.43 MB
- File Type: ZIP / TIFF
- ICC color profile embedded
- Delivered instantly via download link
This is a c. 1930 Geographia pictorial city map of London, England. A comical piece, London is depicted from Hyde Park to St. Paul's Cathedral and from Regents Park to St. George's Circus and Elephant and Castle. The creator's creativity is evident, particularly at the bottom left where Elephant and Castle is illustrated as an elephant with a castle on its back. The law courts are noted by a caricature of a jurist, and the zoo in Regent's Park houses a very large, but cheerful, monster. Savile row, the famous street renowned for its bespoke tailoring, is marked by a very tall man being measured for a suit. The client is so tall that the tailor is illustrated standing on a ladder to get the needed measurements. Nelson's Column in Trafalgar Square sits at the center of a merry-go-round of cars. Other locations around the city, such as St. Paul's, the Houses of Parliament, Westminster Abbey, Buckingham Palace, the British Museum, the National Gallery, and the Victoria and Albert Museum, are illustrated in a more conventional monumental manner. London's train stations, Euston, St. Pancras, King's Cross, Charing Cross, and Victoria, are illustrated and labeled as well. The parts of the United Kingdom served by each station are also noted. Tube stations are marked by red signs akin to those used to mark Underground stations throughout London. (more details)
A lovely pictorial map of Barcelona, Spain.
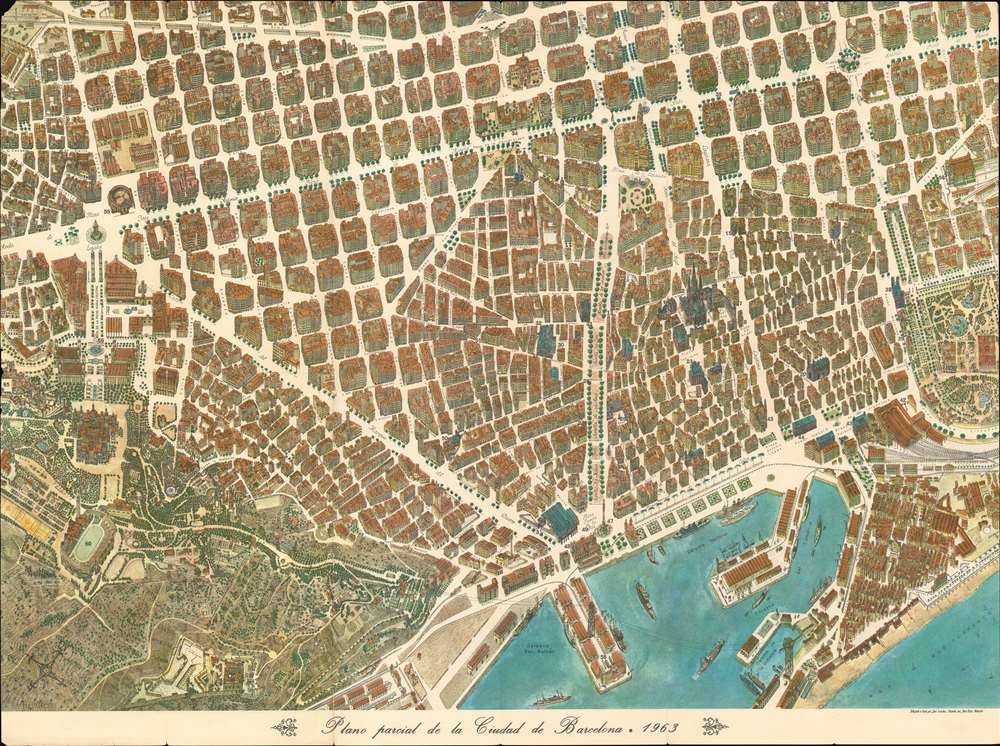
Plano parcial de la Ciudad de Barcelona.
sold
- Digital Map Information
- Suitable for large format printing
- File Size: 88.37 MB
- File Type: ZIP / TIFF
- ICC color profile embedded
- Delivered instantly via download link
This is a 1963 José Loeches and José Ruiz Navarro pictorial map of Barcelona, Spain. Created in the style of late 19th and early 20th century 'monumental' maps, the map blends together a city plan and a view. All of Barcelona's buildings are drawn at a slight angle, allowing the viewer to have an understanding of what the building looks like as they walk past it. Stretching from the Poble Espanyol (Pueblo Español de Montjuich to the Parque de la Ciudadela (Ciutadella Park) and from the Estacion de Sans (Barcelona Sants train station) to Mediterranean Sea, each building within the maps scope is illustrated in detail. Barcelona Cathedral, just to the right of center, immediately draws the viewer's attention. Streets throughout the city are labeled, as are squares and plazas. Sixty-eight locations around the city are numerically labeled and correspond with an index printed on the verso. Among these locations are several museums, churches, schools, and government buildings. (more details)
The first map to show California as an Island!
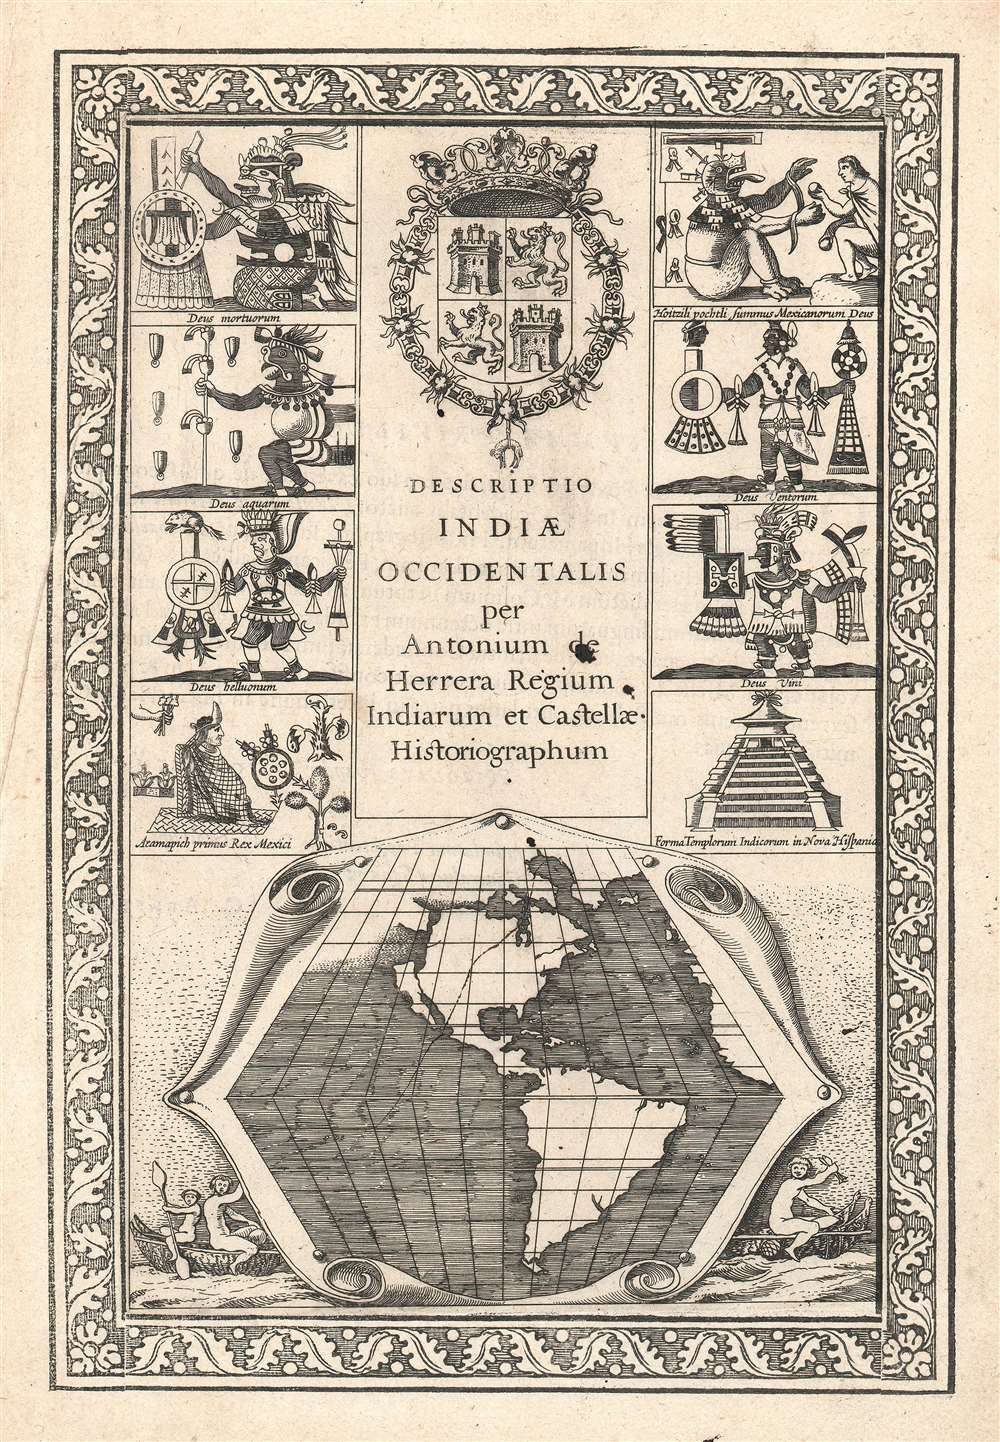
Descriptio Indiae Occidentalis per Antonium de Herrera.
sold
- Digital Map Information
- Suitable for large format printing
- DPI: 600
- File Size: 11.42 MB
- File Type: ZIP / TIFF
- ICC color profile embedded
- Delivered instantly via download link
This seminally important 1622 map is considered the first to illustrate California as an Island. This map is actually part of the title page of the Michiel Colijn expanded edition of Antonio de Herrera y Tordesillas's Descriptio Indiae Occidentalis. The map, appearing at bottom center, is simple but masterfully engraved. It argues for three important and revolutionary ideas:
- California as an Island An open Northwest Passage
- A large river just north of California
View of Chicago in the year of its founding!
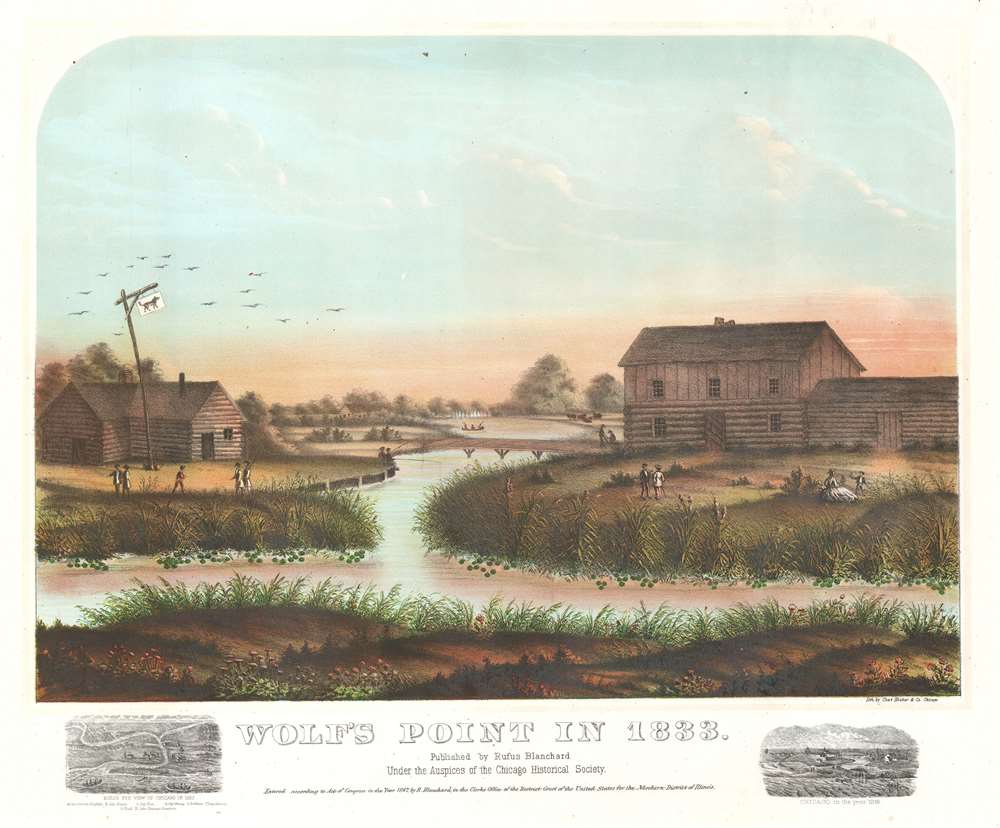
Wolf's Point in 1833.
sold
- Digital Map Information
- Suitable for large format printing
- File Size: 29.24 MB
- File Type: ZIP / TIFF
- ICC color profile embedded
- Delivered instantly via download link
This is a rare 1867 view of Wolf's Point, Chicago, as it appeared near sunset on a summer day in 1833, the year of Chicago's founding. Located at the confluence of the North, South and Main Branches of the Chicago River, Wolf's Point is the earliest site of major development in Chicago, where the city's first shops, taverns, hotels, and theaters were located. Here, Wolf Point Tavern appears on the left, at the time under the management of William Walters (1833 – 1836), with its famous 'wolf' flag. On the opposite bank of here river, a two-story building and adjoining log cabin, possibly represent Miller’s Tavern and store. In the background a simple plank bridge crosses the Chicago River. The foreground reveals a grassy riverside, on which men and women fish, picnic, and generally frolic. Although issued just 34 years after the founding of Chicago, this view already paints the city's early days in the warm tones of nostalgia. (more details)
An exquisite large-format map of Italy made during the French Revolutionary Wars.
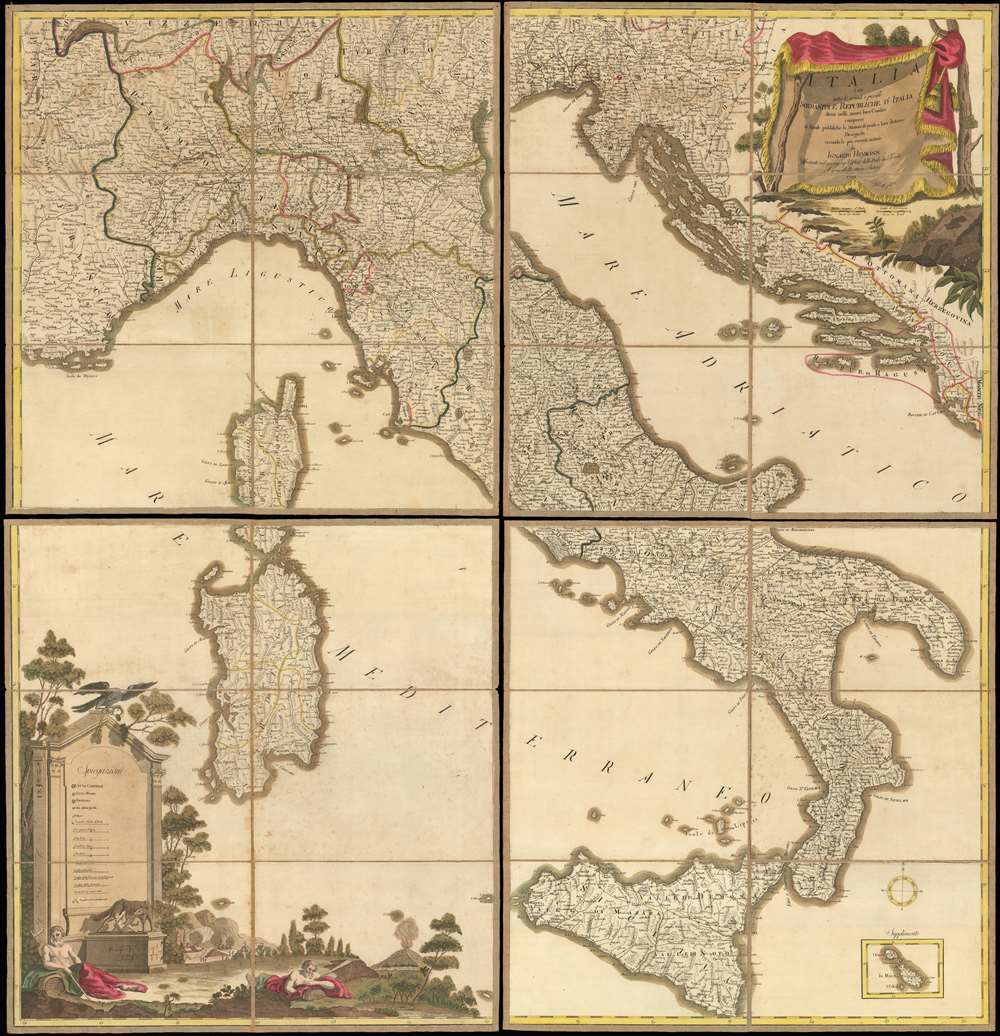
Italia cioè tutte le grandi e picciole Sovranità e Republiche d'Italia divise nelli nuovi loro Confini, comrese le Strade pubbliche, le Stazioni di posta e loro distanze Disegnata secondo le più recenti notizie.
sold
- Digital Map Information
- Suitable for large format printing
- DPI: 600
- File Size: 135.81 MB
- File Type: ZIP / TIFF
- ICC color profile embedded
- Delivered instantly via download link
A beautifully executed 1799 Ignaz Heymann old-color wall map of Italy sectionalized and laid down on linen. Depicting Italy in full, the map covers from Toulon, France to Montenegro and from Lausanne, Switzerland to Sicily. The map captures Italy at the beginning of the War of the Second Coalition (1799 - 1800), fought between the European monarchies and Revolutionary France. Chronicled here are nearly all the battles of the War of the First Coalition (1792 - 1797), each of which is marked by a pair of crossed swords. Fought around the cities of Lodi, Manua, Mondovì, Codogno, Rovereto, and Bassano, among others, almost all were resounding French victories over the opposing Piedmontese and Austrian armies. (more details)
Created shortly after the 1846 Cracow Uprising.
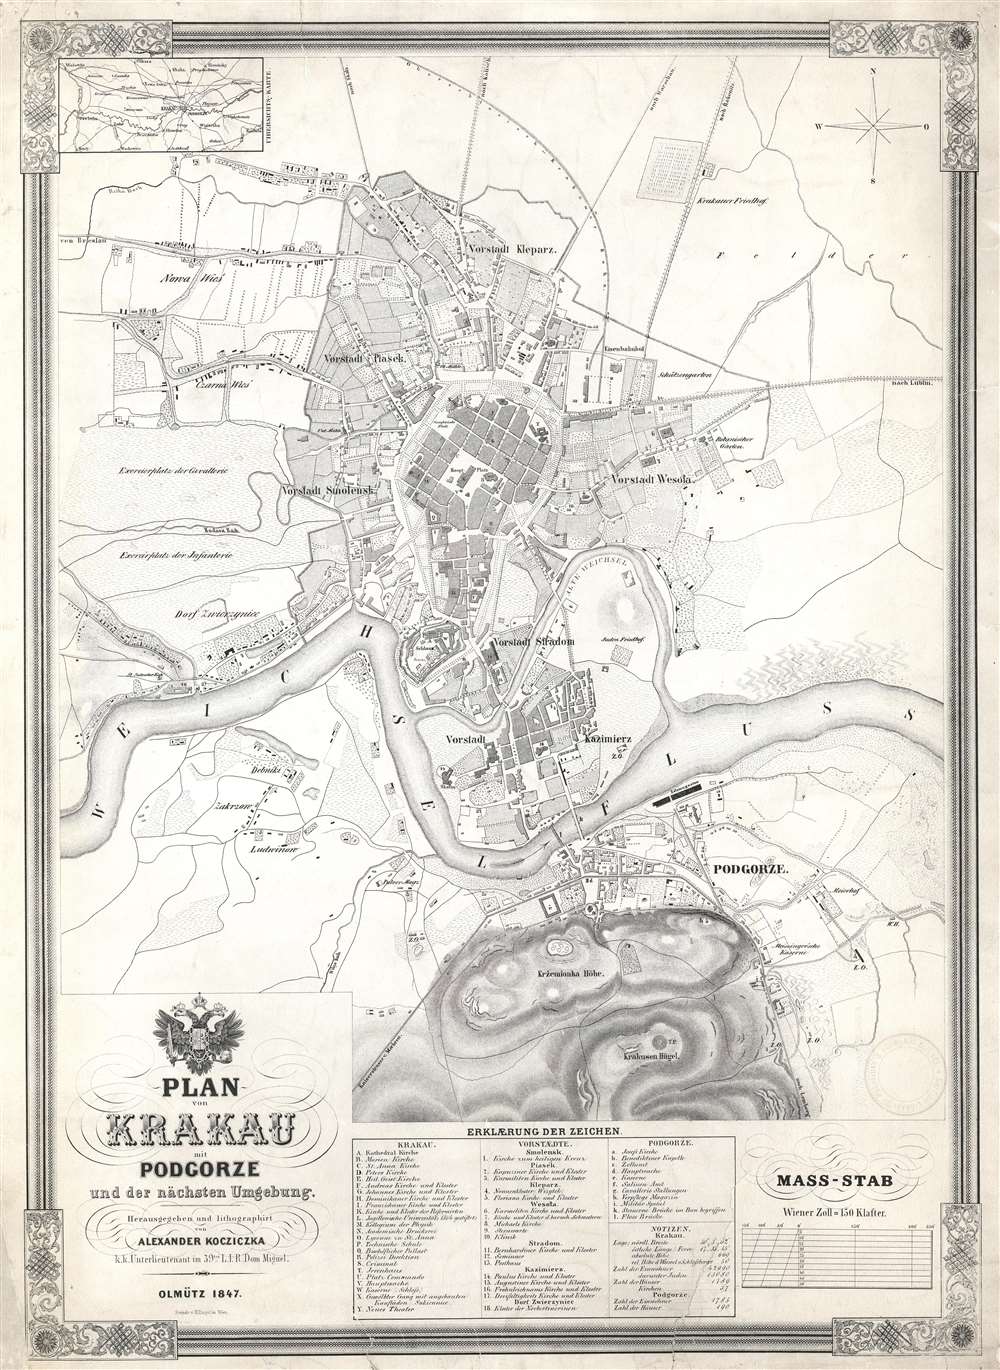
Plan von Krakau mit Podgorze und der nächsten Umgebung.
sold
- Digital Map Information
- Suitable for large format printing
- DPI: 600
- File Size: 30.66 MB
- File Type: ZIP / TIFF
- ICC color profile embedded
- Delivered instantly via download link
This is an 1847 Alexander Kocziczka city map or plan of Kraków, Poland. The map depicts Kraków from Czarna Wieś and Nowa Weiś to Podgorze and from the Upper Silesian - Kraków Railway to the Krakus Mound. Central Kraków is shaded darker than the rest of the map, making the city center the focal point. Twenty-five different locations are alphabetically identified throughout, among them churches, convents, and the theater, all correspond to a key situated along the bottom border. Eighteen locations in surrounding communities are also identified. In the town of Podgorze, across the Vltava River, 11 sites are numerically identified. Both the infantry and cavalry training grounds are noted along the left border, while the roads to Breslau, Warsaw, and Lublin are identified. (more details)
An exceptionally beautiful exampel of Cary's large-format case map of the British Isles.
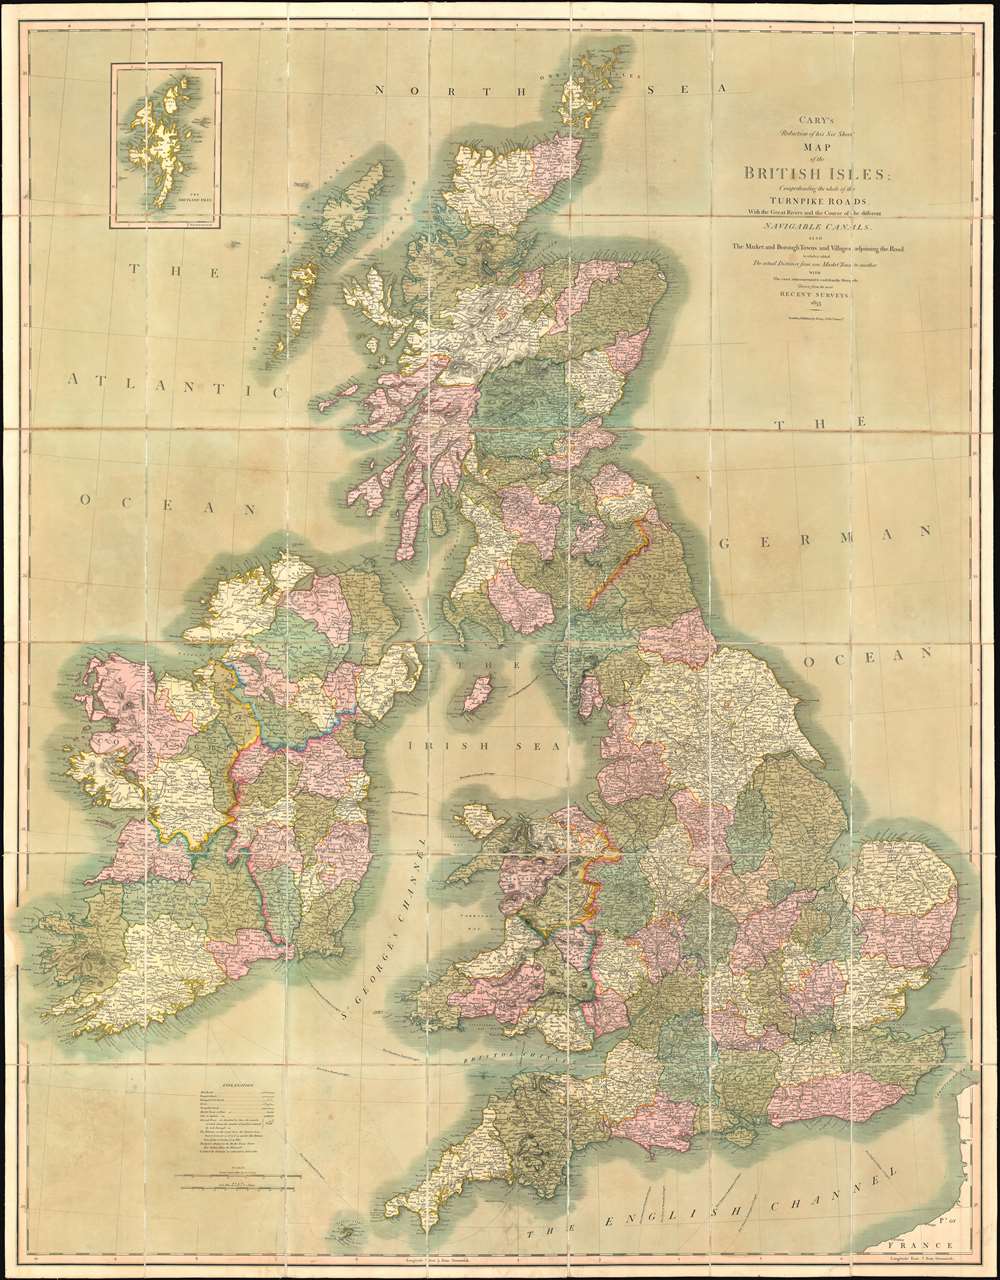
Cary's Reduction of his Six Sheet Map of the British Isles; Comprehending the whole of the Turnpike Toads, With the Great Rivers and the Course of the different Navigable Canals, also the Market and Borough Towns and Villages adjoining the Road, to which is added The actual Distance from one Market Town to another, with The exact admeasurement to each from the Metropolis.
sold
- Digital Map Information
- Suitable for large format printing
- DPI: 600
- File Size: 146.61 MB
- File Type: ZIP / TIFF
- ICC color profile embedded
- Delivered instantly via download link
This is a stunning 1833 John Cary large-format folding case map of the British Isles. The map depicts the entirety of the British Isles, including England, Scotland, Wales, and Ireland. Coverage extends from the Blasket Islands and County Kerry in Ireland to the North Sea and from the Orkney Islands to the English Channel and northern France. Cities towns, and villages throughout the Isles are labeled, including London, Glasgow, Edinburgh, Dublin, and Belfast. Counties are identified and shaded different colors to allow for easy differentiation. Mail roads, turnpike roads, and principal cross roads are also illustrated. (more details)
A comical and incredibly charming pictorial map of Yosemite National Park.
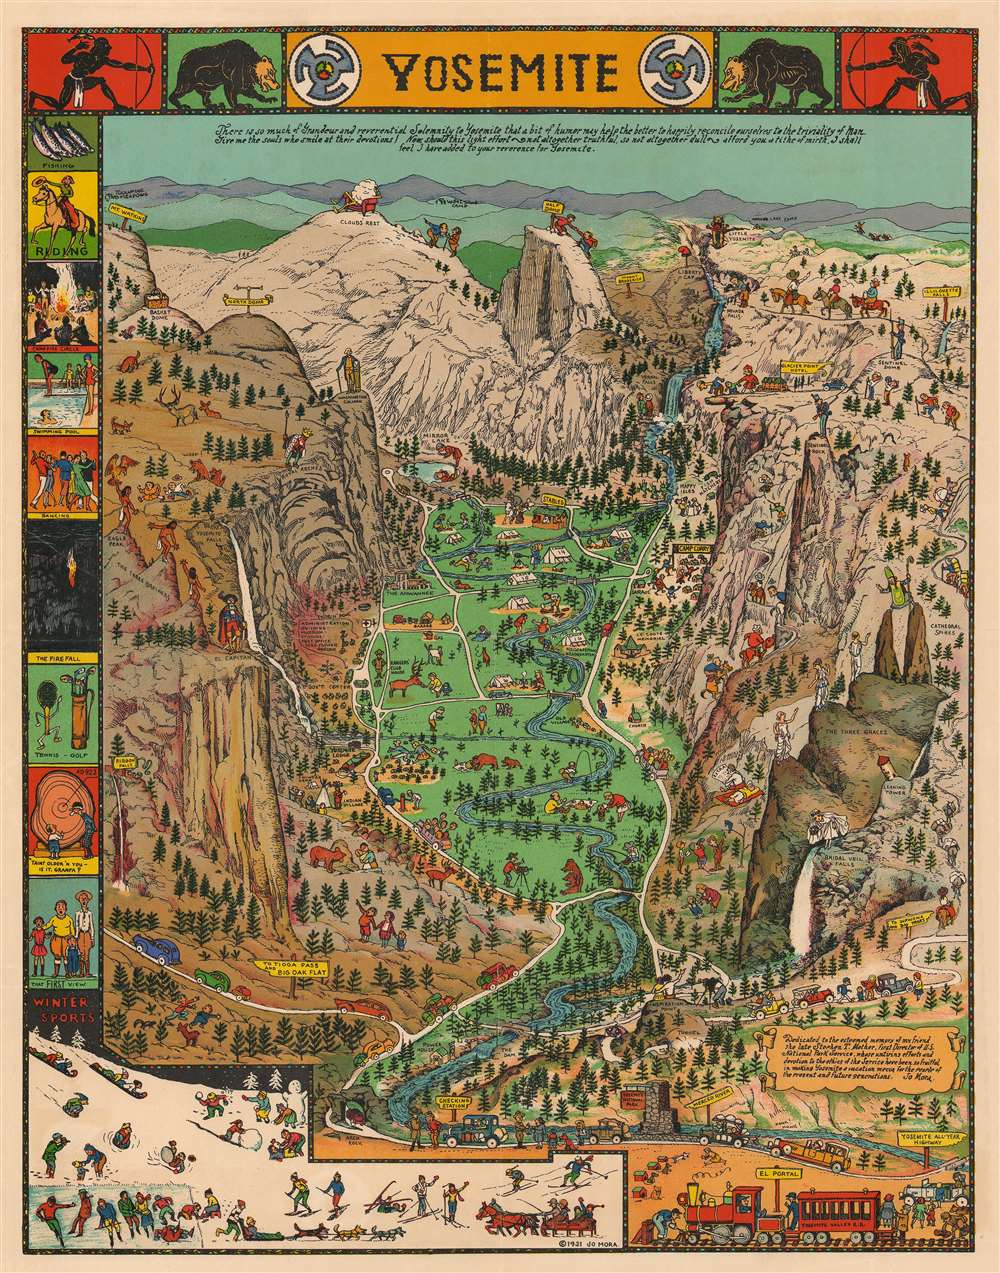
Yosemite.
sold
This is a 1941 Jo Mora pictorial map of Yosemite National Park in California. The map centers on Yosemite Valley and identifies several of the granite peaks that surrounds the valley, including Half Dome and El Capitan. Most of these peaks are topped by comical illustrations of their names. A Spanish conquistador, for example, stands atop El Capitan, a cloud lounges in an easy chair at the summit of Clouds Rest (the highest peak around Yosemite Valley), and George Washington appears at the top of Washington Column. A bride in her wedding gown and veil peers over Bridalveil Falls, while a bishop precariously straddles Cathedral Spires. Vernal Falls, Nevada Falls, and Yosemite Falls are all illustrated and labeled.
The valley itself, as well as the granite heights surrounding it, is filled with tourists enjoying their time in the park. People are illustrated picnicking, camping, fishing, swimming in the river, feeding deer, and fleeing bears who have decided to help themselves to their picnic! Another visitor is taking a photographic portrait for a couple of bears. Still others appear on horseback or hiking the steep trails. Cars filled with awe-struck admirers of the landscape travel along the meandering roads toward campsites and lodges. A border featuring vignettes of activities at the park, including swimming, a campfire circle, horseback riding, winter sports, and fishing, is situated along the left side. A text box in the lower right corner bears a dedication to Mora's friend Stephen T. Mather, the first Director of the U.S. National Park Service. (more details)
The valley itself, as well as the granite heights surrounding it, is filled with tourists enjoying their time in the park. People are illustrated picnicking, camping, fishing, swimming in the river, feeding deer, and fleeing bears who have decided to help themselves to their picnic! Another visitor is taking a photographic portrait for a couple of bears. Still others appear on horseback or hiking the steep trails. Cars filled with awe-struck admirers of the landscape travel along the meandering roads toward campsites and lodges. A border featuring vignettes of activities at the park, including swimming, a campfire circle, horseback riding, winter sports, and fishing, is situated along the left side. A text box in the lower right corner bears a dedication to Mora's friend Stephen T. Mather, the first Director of the U.S. National Park Service. (more details)
An Israeli map of the 1956 Suez Crisis.
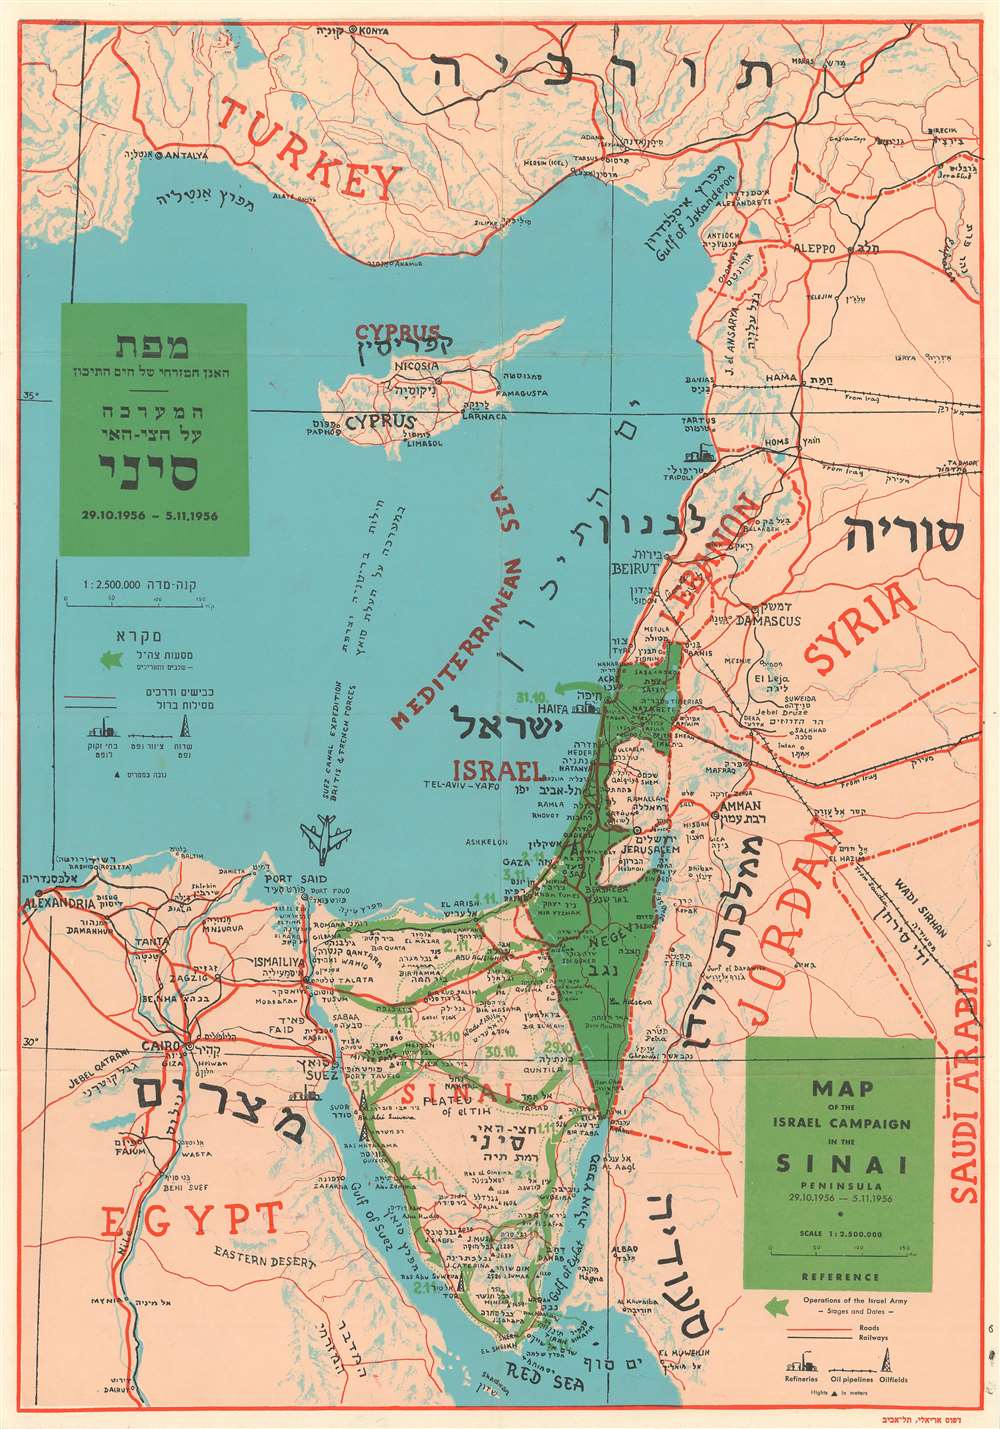
Map of the Israel Campaign in the Sinai Peninsula.
sold
- Digital Map Information
- Suitable for large format printing
- File Size: 12.63 MB
- File Type: ZIP / TIFF
- ICC color profile embedded
- Delivered instantly via download link
This is a 1956 Shapiro bilingual English and Hebrew map of the Middle East centered on Israel during the 1956 Suez Crisis, which is also known as the Second Arab-Israeli War. Tracing the events of the war, the map depicts the region from Alexandria, Egypt to Syria and Saudi Arabia and from Turkey to the Red Sea. Israel is shaded in green, making it stand out in contrast to the other countries in the region, and the movements of the Israeli armed forces across the Sinai Peninsula are also illustrated in green. These arrows are dated, allowing the viewer to follow the movements of the Israelis throughout the course of the war. A notation in the Mediterranean Sea also marks the presence of the British and French Suez Canal Expedition, complete with an illustration of a fighter jet.
Cities, towns, and villages throughout the region are labeled in both English and Hebrew, with particular attention paid to Israel and the Sinai Peninsula. Roads and railways are also illustrated, as are oil fields, oil pipelines, and refineries. (more details)
Cities, towns, and villages throughout the region are labeled in both English and Hebrew, with particular attention paid to Israel and the Sinai Peninsula. Roads and railways are also illustrated, as are oil fields, oil pipelines, and refineries. (more details)
A view of Notre Dame before its 19th century restoration project undertaken by French architect Eugène Emmanuel Viollet-le-Duc and the construction of its iconic spire.

Vue de l'Abside de Notre-Dame et de nouvelle fontaine.
sold
- Digital Map Information
- Suitable for large format printing
- DPI: 600
- File Size: 15.75 MB
- File Type: ZIP / TIFF
- ICC color profile embedded
- Delivered instantly via download link
This is a c. 1845 Jules Arnout view of the apse and east end of Notre Dame Cathedral in Paris, France. Notre Dame dominates the view, with its flying buttresses and the beautiful stained-glass windows of the apse, notably without its iconic spire (which had not yet been built). The Square Jean XXIII and the brand-new Fontaine de la Vierge (Fountain of the Virgin) are situated in the foreground, with several groups of children playing the park (the first of its kind in the neighborhood) and gentlemen in top hats wandering the streets and through the garden. Notre Dame's transept is illustrated, and the tops of its iconic towers are visible just over the transept's roof. (more details)
Rare Jewish issued map of Cape Town, South Africa during a period of rapid modernizaiton.
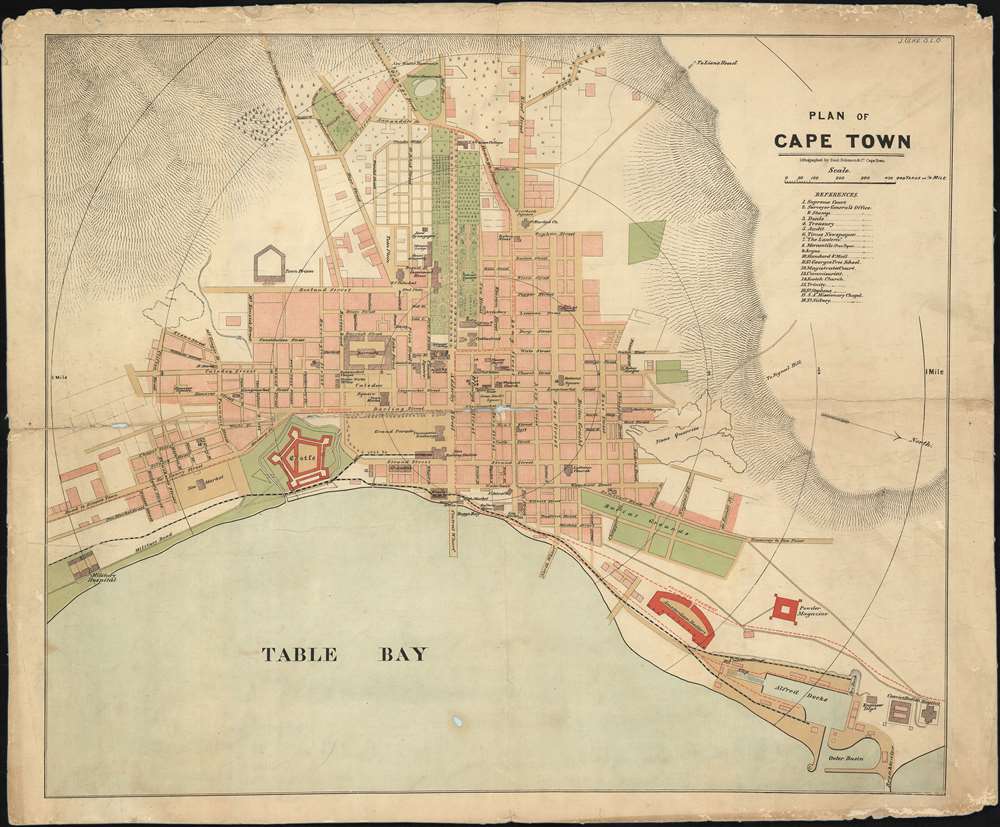
Plan of Cape Town.
sold
- Digital Map Information
- Suitable for large format printing
- File Size: 32.98 MB
- File Type: ZIP / TIFF
- ICC color profile embedded
- Delivered instantly via download link
An exceptional discovery, this is an unrecorded separately-issued 1882 map of Cape Town drawn by American Julius Ulke and issued by the famous Jewish-South African publisher, Saul Solomon. The map is oriented roughly to the west, with north on the right side of the map. It covers the city during a period of major growth and expansion - an in in fact, one of the few city plans to illustrate Cape Town during the transformative 1870s and early 1880s. (more details)
Presents geographical thought from between the French and Indian War and the American Revolution.
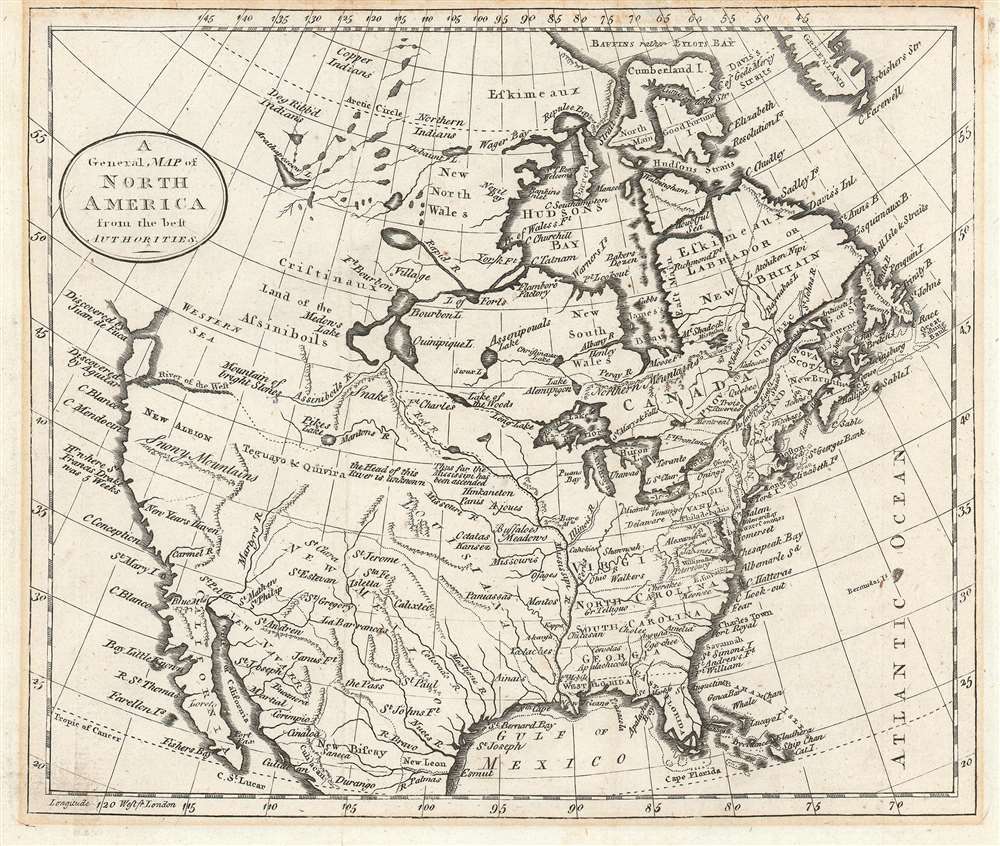
A General Map of North America from the best Authorities.
sold
- Digital Map Information
- Suitable for large format printing
- DPI: 600
- File Size: 5.1 MB
- File Type: ZIP / TIFF
- ICC color profile embedded
- Delivered instantly via download link
This is a c. 1785 William Guthrie map of North America that is based upon a c. 1770 Thomas Kitchin map of North America after the French and Indian War and before the American Revolution. Depicting the continent from the Pacific Ocean to the Atlantic Ocean and from Baffin's Bay to Mexico, and the Gulf of Mexico, the map provides an overview (although slightly flawed) of the state of affairs on the North American continent at the pivotal point in world history. (more details)