
Spectacular 'Englishified' large format map of Florida.
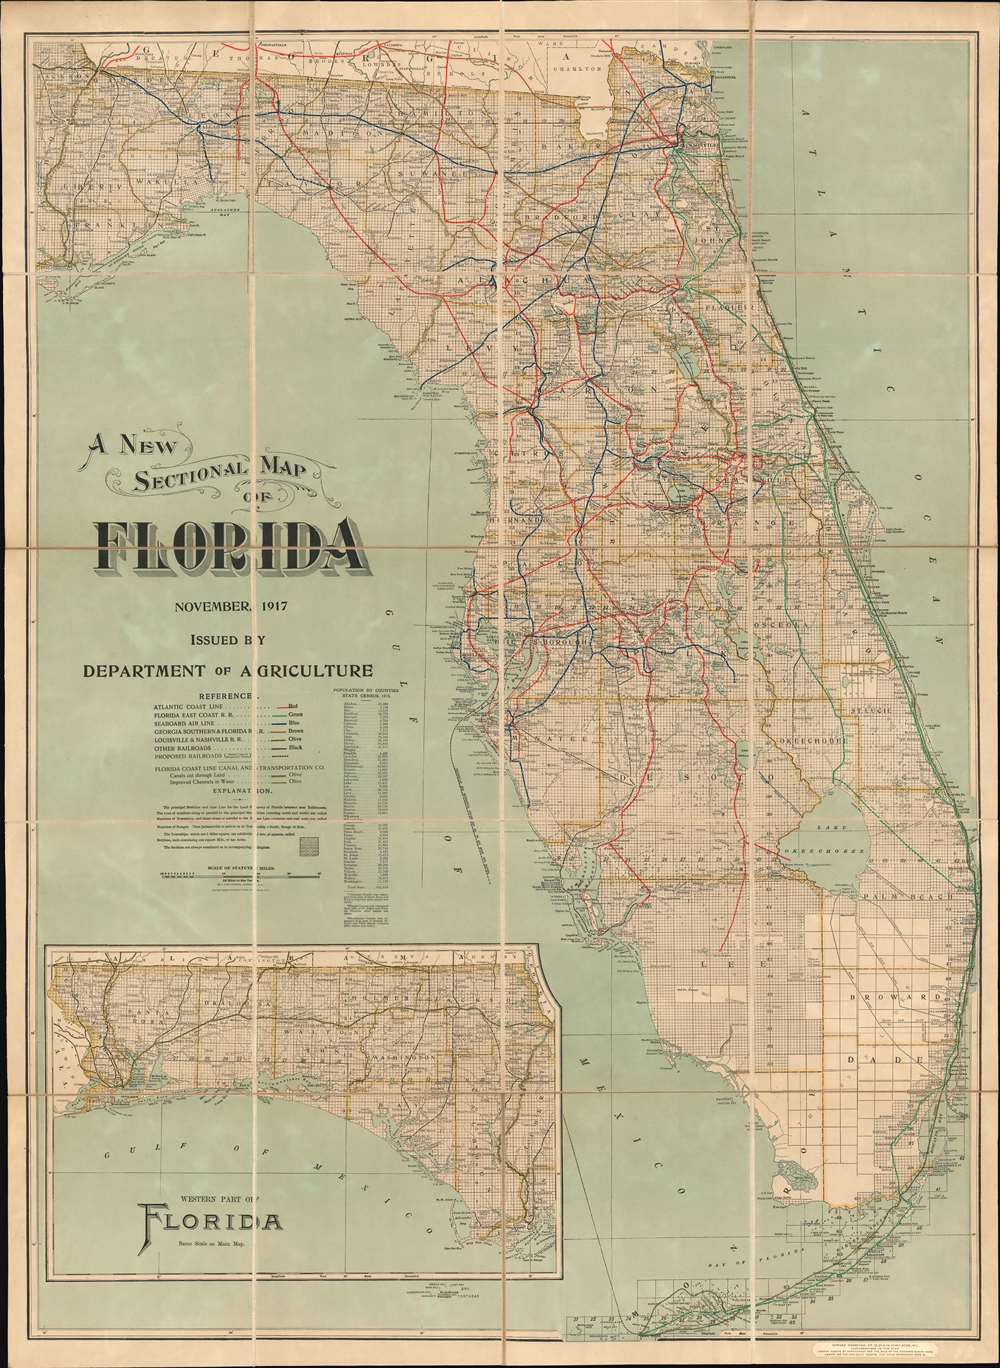
A New Sectional Map of Florida.
sold
- Digital Map Information
- Suitable for large format printing
- Full resolution TIFF file
- ICC color profile embedded
- Delivered instantly via download link
A spectacular 1917 large format map of Florida issued by the Matthews-Northrup Company for the Florida Department of Agriculture. The map covers all of peninsular Florida, including the Florida Keys. An inset in the lower left details the Florida Panhandle. The map is broken into rectilinear platting (land grids) - betraying the source material as the state and federal land surveys. Despite being issued by the Department of Agriculture, this is very much a transportation map, with detailed breakdowns of Florida railroads as of 1916, including the Florida East Coast Railway, which extends all the way to Key West. It also notes inlands waterway routes, noting canals and improvements. (more details)
North Part of the World Known to Europe in the Age of Discovery.
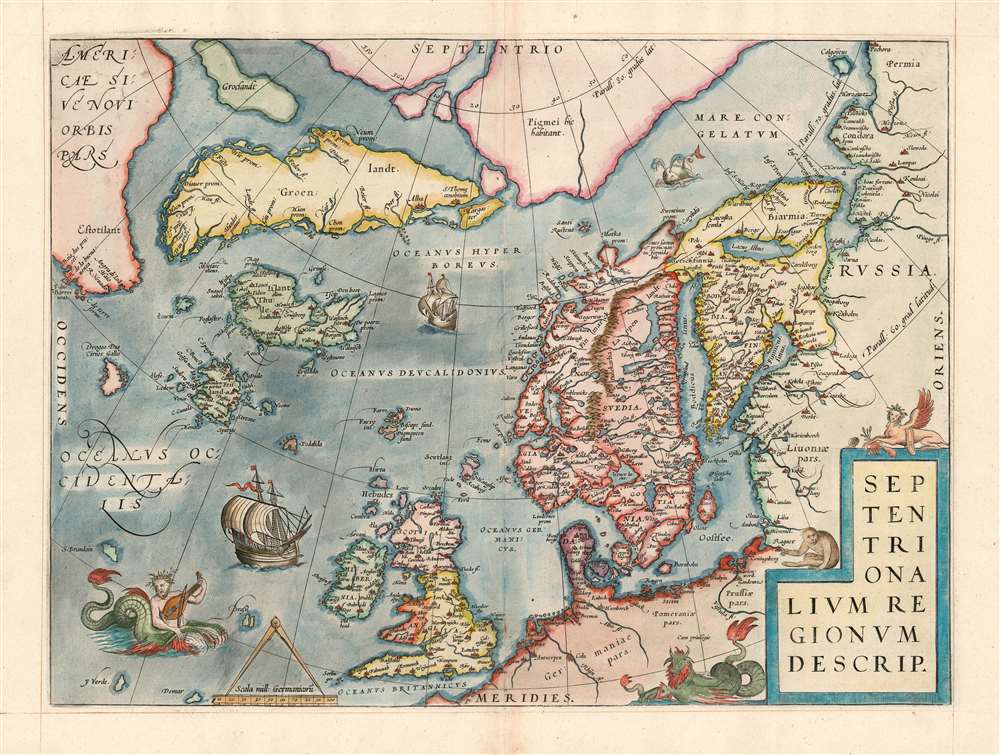
Septentrionalum Regionum Desrip.
sold
- Digital Map Information
- Suitable for large format printing
- Full resolution TIFF file
- ICC color profile embedded
- Delivered instantly via download link
One of Abraham Ortelius' most interesting maps, this is his 1570 map of the Arctic, here in a transitional example between the first and second states as recorded in van den Broecke. The map covers the northern regions from the English Channel to the just south of the North Pole and from America to Russia, including England, Scandinavia, Finland, Denmark, Iceland, and Greenland, as well as parts of America (Estotiland), the apocryphal island of Friesland, and Mercator's speculative Arctic islands. (more details)
Central Asia at the Dawn of Tsarist Russia
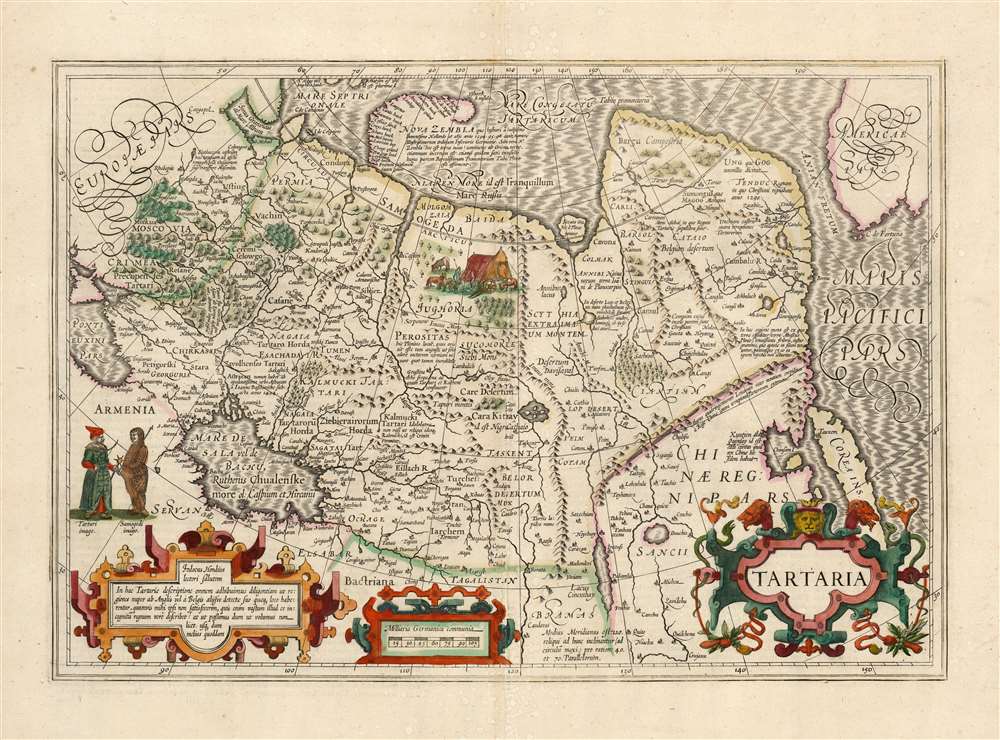
Tartaria
sold
- Digital Map Information
- Suitable for large format printing
- Full resolution TIFF file
- ICC color profile embedded
- Delivered instantly via download link
This is a beautiful, original-color example of Jodocus Hondius' 1606 map of Tartary: Northern Asia, extending from Muscovy and the Black Sea in the west, to the Strait of Anian, China, Korea and the Pacific Ocean in the east. At the furthest extreme of the map is part of North America. The map reaches from the Arctic, as far south as 30 degrees above the equator, embracing the Caspian Sea. (more details)
Southern Luzon during the Philippine-American War.

Southern Luzon. Showing Portion of Theater of Operations. 8th Army Corps, Major General Elwell S. Otis, Commanding.
sold
- Digital Map Information
- Suitable for large format printing
- File Size: 35.23 MB
- File Type: ZIP / TIFF
- ICC color profile embedded
- Delivered instantly via download link
This is an extremely scare map of Central Luzon, the Philippines, issued at the height of the Philippine-American War (1899 - 1902) by the Military Governor in the Philippines, Major General Elwell Stephen Otis, and the 8th Army Engineering Corps. It ranks among the most detailed cartographic productions to emerge from the Philippine-American War. Although titled 'Southern Luzon,' this map, in fact, covers Central Luzon, specifically the lands including and just south of Manila, surrounding the Laguna de Bay, as far as the Quezon Isthmus and Isla Verde. During the early stages of the Philippine-American War, this area was primarily controlled by Philippine forces and was the most active theater. The map offers detailed topography via shading throughout and identifies roadways, towns, cities, political boundaries, telegraph lines, and more. (more details)
Illustrates France's Champagne wine region
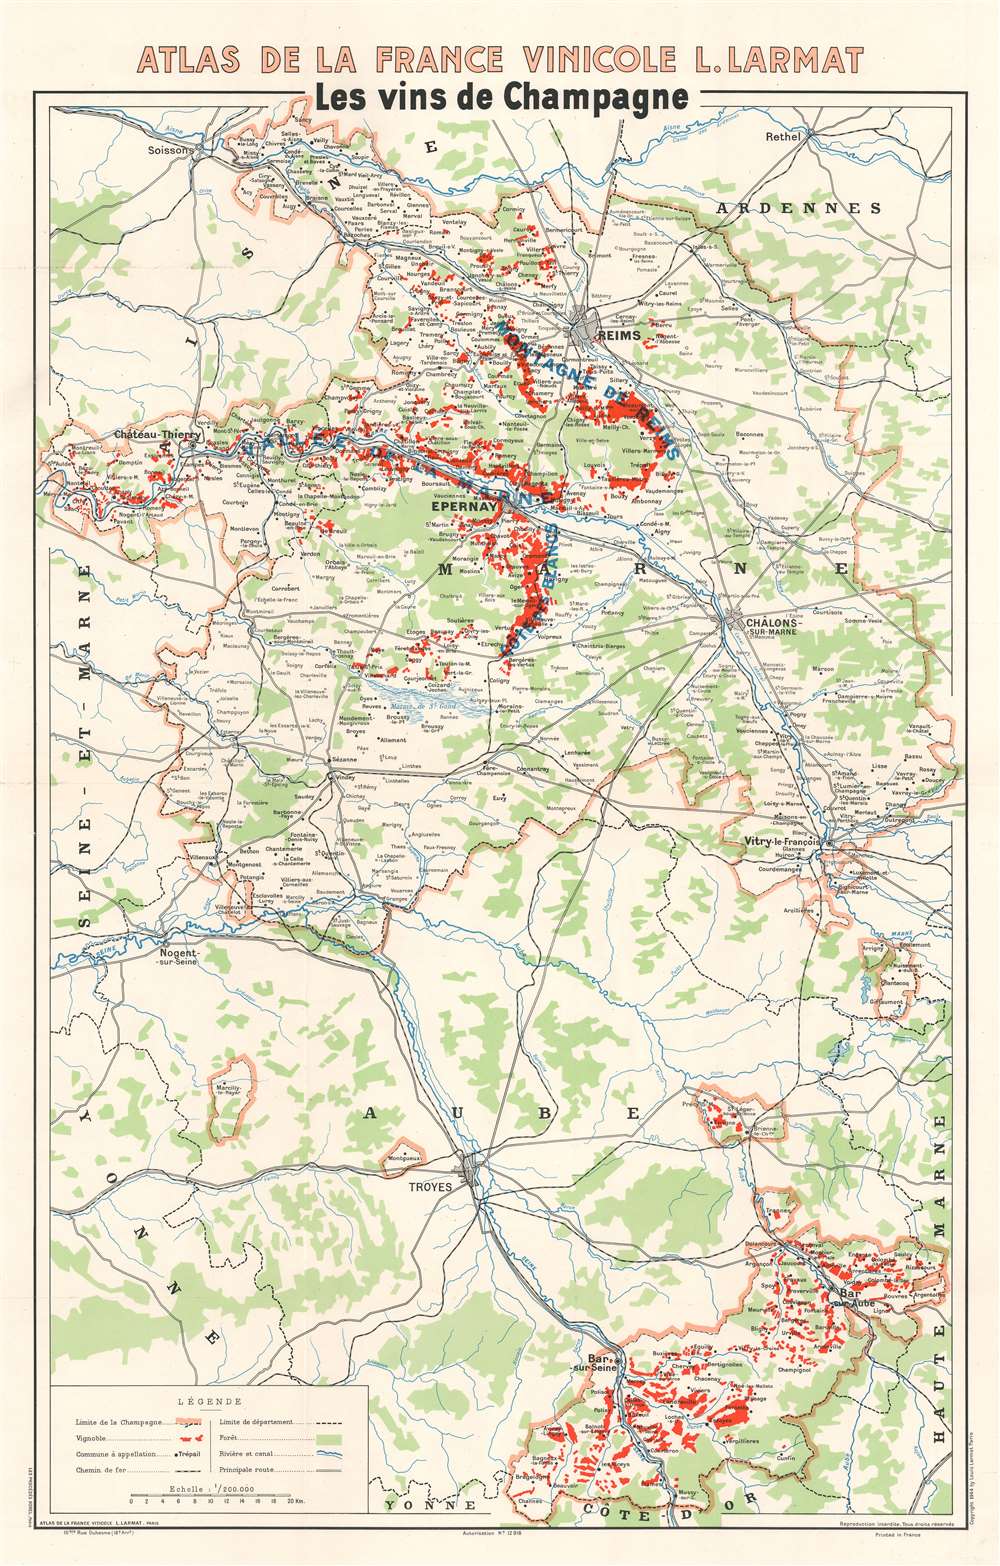
Les vins de Champagne
sold
- Digital Map Information
- Suitable for large format printing
- File Size: 33.84 MB
- File Type: ZIP / TIFF
- ICC color profile embedded
- Delivered instantly via download link
This is a 1944 Louis Larmat map of the Champagne wine region in France. Depicting from Soissons and Rethel to the Côte-d'Or and from Ste. Aulde in the Champagne region to the Departement de la Haute-Marne, thick pink lines surround the Champagne wine region, which is not a geographically contiguous area. Within the Champagne region, small towns and hamlets associated with the Champagne industry are labeled, and areas shaded red highlight vine-growers. Major cities in and around the Champagne region include Reims, Châlons-sur-Marne, and Troyes. Major roads and railroads are illustrated, along with rivers, swamps, and forested areas. In many parts of the world, in order for a wine to be labeled as Champagne unless it came from the Champagne wine region of France. (more details)
Zionism! Jewish-owned land in British Palestine.

EREZ ISRAEL ארץ ישראל
sold
- Digital Map Information
- Suitable for large format printing
- File Size: 31.86 MB
- File Type: ZIP / TIFF
- ICC color profile embedded
- Delivered instantly via download link
This c. 1925 Jewish National Fund Zionist map of Jewish land in Palestine highlights the Jewish National Fund's (JNF) push to acquire land in Palestine for Jewish settlement. Areas shaded black indicate land owned by the JNF where it established Jewish settlements. Although unclear from reading the map, the JNF likely founded many of the smaller settlements identified. Major cities outside the areas are identified, including Jerusalem, Bethlehem, Tel Aviv, Jaffa, and Haifa. The JNF, founded as part of the early 20th-century Zionist movement, played a critical role in establishing Tel Aviv. Major highways (and possibly railroads) are illustrated as well. (more details)
A monumental map of Havana, Cuba in the tradition of tourist maps created for European capitals.
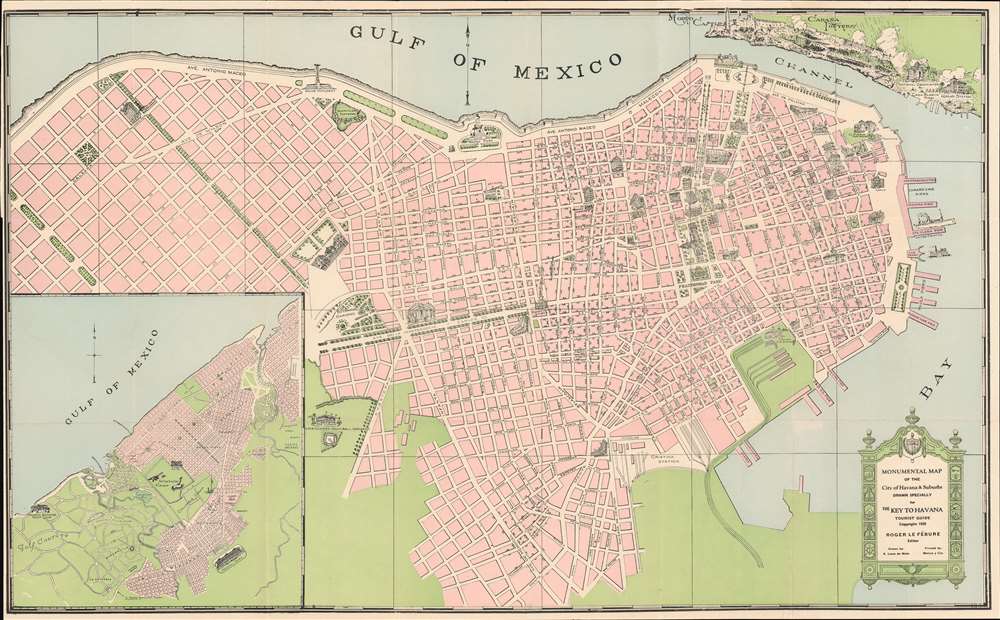
Monumental Map of the City of Havana and Suburbs. Drawn Specifically for the Key to Havana tourist Guide.
sold
- Digital Map Information
- Suitable for large format printing
- File Size: 25.61 MB
- File Type: ZIP / TIFF
- ICC color profile embedded
- Delivered instantly via download link
This is a 1928 Antonio Loret de Mola pictorial map of Havana, Cuba. The map depicts the city from Villalón Park and the Avenida Paseo to Havana Harbor and from Morro Castle, La Cabaña Fortress, and the Entrance Channel to Cristina Station. Beautifully illustrated, numerous sites around the city are illustrated in profile, including several hotels, the Congress building, the House of Representatives, the National Library, the National University, and the national theatre. Monuments throughout the city are also shown, including the Maine Monument, which was erected in 1925 in remembrance of the victims of the USS Maine, and the monument to Antonio Maceo Grajales, the second-in-command of the Cuban Army of Independence. Special attention is paid to Havana's fortresses, such as the La Cabaña (Fortaleza de San Carlos de la Cabaña), the third largest fortress in the Americas, and Morro Castle (Castillo de Los Tres Reyes del Morro). City parks, illustrated in green, are scattered all around the city. An inset map situated in the lower left corner focuses on western Havana and highlights the 'aviation field', Columbia Camp, and the Havana Biltmore Yacht Club. (more details)
A fantastic color chart of comets and the Leonid meteor shower.

Comets and Aerolites.
sold
- Digital Map Information
- Suitable for large format printing
- Full resolution TIFF file
- ICC color profile embedded
- Delivered instantly via download link
This is a c. 1851 James Reynolds chart of comets and meteorites. Aerolite, the word used by Reynolds in the chart's title, is an archaic term for a meteorite. A dozen comets appear within the black oval at the center and surround a diagram of a comet's orbit. A reference table, situated at the bottom center, identifies the celestial bodies illustrated here. Among these are the comet of 1680, Halley's comet, the comet of 1741 'having six tails,' and numbers six through twelve are 'comets described by ancient authors.' Short texts describing comets and aerolites appear along the left and right sides, and stunning illustrations of meteor showers occupy the bottom left and right corners. Today, these meteor showers are known as the Leonids and peak annually in November. The 1833 shower or storm, as they are also known, was the first to break into popular consciousness and brought fame and notoriety to the event. Estimates for the peak rate of the 1833 storm range from over 100,000 meteors an hour to numbers in excess of 240,000 throughout the entire nine-hour event. (more details)
Includes Chateau-Thierry.

'Les vins de Champagne' Vallée de la Marne et l'Aisne.
sold
- Digital Map Information
- Suitable for large format printing
- File Size: 28.64 MB
- File Type: ZIP / TIFF
- ICC color profile embedded
- Delivered instantly via download link
This is a 1944 Louis Larmat map of the western Marne Valley and the Aisne Champagne vineyards in France. Depicting from the Département de la Seine-et-Marne to Damery and Fleury-la-Riviere and from Ste. Gemme to Verdon, the map focuses on the grape producers, the vignobles. Black dashed lines create the boundaries of the departments (France's regional divisions) and dotted lines separate the region's villages, including Baulne-en-Brie, Chateau-Thierry, Dormans, and Oeuilly. Roads and railroads are illustrated, as are wooded areas. An inset in the lower-right corner details situates the present map within the Champagne region. The various colors used as shading throughout the map represent the ratings of the échelle des crus, the way of ranking the quality of grape grown in a given location in the Champagne region. These ratings are based on a percentage scale out of 100, and when the system was instituted, each village, not each specific winery, was given a percentage out of 100. Here, five colors are used to mark the different percentages. Grand crus grapes, deemed to be the highest-quality grapes which received a 100% rating, were paid 100% of that a given year's set price. Thus the percentage assigned to the village determined the percentage any given grower would receive for their grapes. (more details)
Details the vine-growing areas of the Marne Valley in the Champagne region of France.
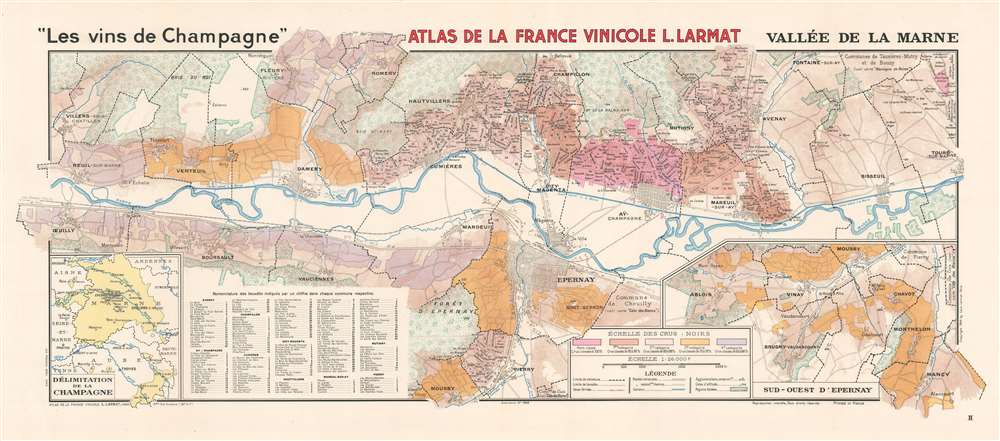
'Les vins de Champagne' Vallée de la Marne.
sold
- Digital Map Information
- Suitable for large format printing
- File Size: 33.7 MB
- File Type: ZIP / TIFF
- ICC color profile embedded
- Delivered instantly via download link
This is a 1944 Louis Larmat map of the Marne Valley (Vallée de la Marne) in the Champagne region of France. Depicting from Oeuilly to Tours-sur-Marne and from Romery and Fleury-la-Riviere to Moussy, the map focuses on the grape producers, the vignobles. Black dashed lines create the boundaries of the region's villages, which include Epernay, Champillon, Aÿ, and Avenay. Nearly two hundred lieuxdits (which roughly translates to hamlet and embodies the idea of a place name that only locals would know) are numerically identified throughout the region and correspond with an index on the bottom left. An inset on the lower right illustrates the region southwest of Epernay. On the lower left a second inset situates the present map within the Champagne region. The various colors represent the ratings of the échelle des crus: noirs, the way of ranking the quality of grape grown in a given location. These ratings are based on a percentage scale out of 100, and when the system was instituted, each village, not each specific winery, was given a percentage out of 100. Here, five colors are used to mark the different percentages. Grand crus grapes, deemed to be the highest-quality grapes which received a 100% rating, were paid 100% of that a given year's set price. Thus the percentage assigned to the village determined the percentage any given grower would receive for their grapes. (more details)
Uses infographics to compare the armies and navies of European countries at the outbreak of World War I.
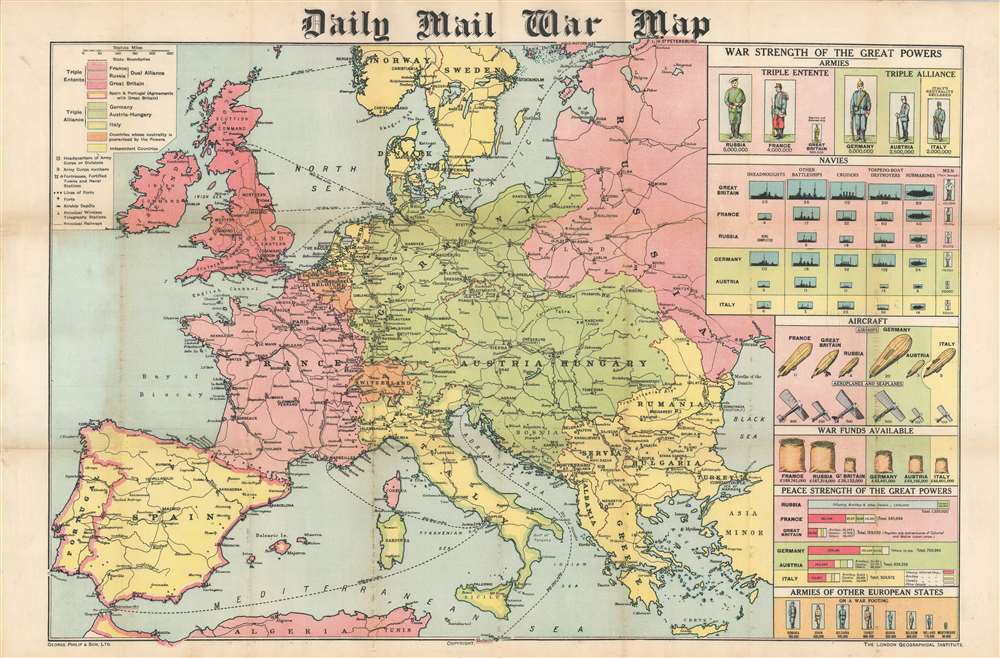
Daily Mail War Map.
sold
- Digital Map Information
- Suitable for large format printing
- File Size: 43.73 MB
- File Type: ZIP / TIFF
- ICC color profile embedded
- Delivered instantly via download link
This is a 1914 George Philip map of Europe at the beginning of World War I. Philip uses colors to illustrate the alliances between the Triple Entente (Great Britain, France, and Russia) and the Triple Alliance (Germany, Austria-Hungary, and Italy). Neutral and independent countries are shaded other colors, although their neutrality did not save them from the onslaught of war in Belgium's case. Major cities are identified across the continent, along with fortresses, airship depots, wireless stations, and railways. Infographics along the right border provide an incredible visual summary of each country's military strength. The infographics create compelling comparisons between the belligerents. The comparison between standing armies, for example, lays bare the shocking difference between the Russian and French armies and the British army. At the same time, the British navy vastly outclasses any of the others in almost every category. Aircraft appear as well, an intriguing prospect in 1914 since airships and airplanes had never before been used in combat. (more details)
Wonderful tourist map of the Catskills from the early 20th century.

Van Loan's Road Map of the Catskills and Vicinity.
sold
- Digital Map Information
- Suitable for large format printing
- Full resolution TIFF file
- ICC color profile embedded
- Delivered instantly via download link
This is a 1904 Walton Van Loan map of the Catskill Mountains in New York. The map depicts the region from Canadarago Lake and Oneonta to the Hudson River and from Richfield Springs to Ellenville and James Point. Red overprinting highlights numerous roads throughout the region (likely routes promoted by Van Loan's Catskill Mountain Guide), and the red numbers provide distances along these routes. Innumerable rivers, streams, brooks, and creeks are illustrated and labeled, along with individual mountains, hills, and other physical features. Towns are labeled throughout, and post offices are identified. Several railroads traverse the region, including the New York Central and Hudson River Railroad; the Delaware, Lackawanna, and Western Railroad; the Lackawanna Division of the Delaware and Hudson Canal Company Railroad; and the Cooperstown and Charlotte Valley Railroad. (more details)
Beautiful and rare, an essential lighthouse guide for the British mariner.
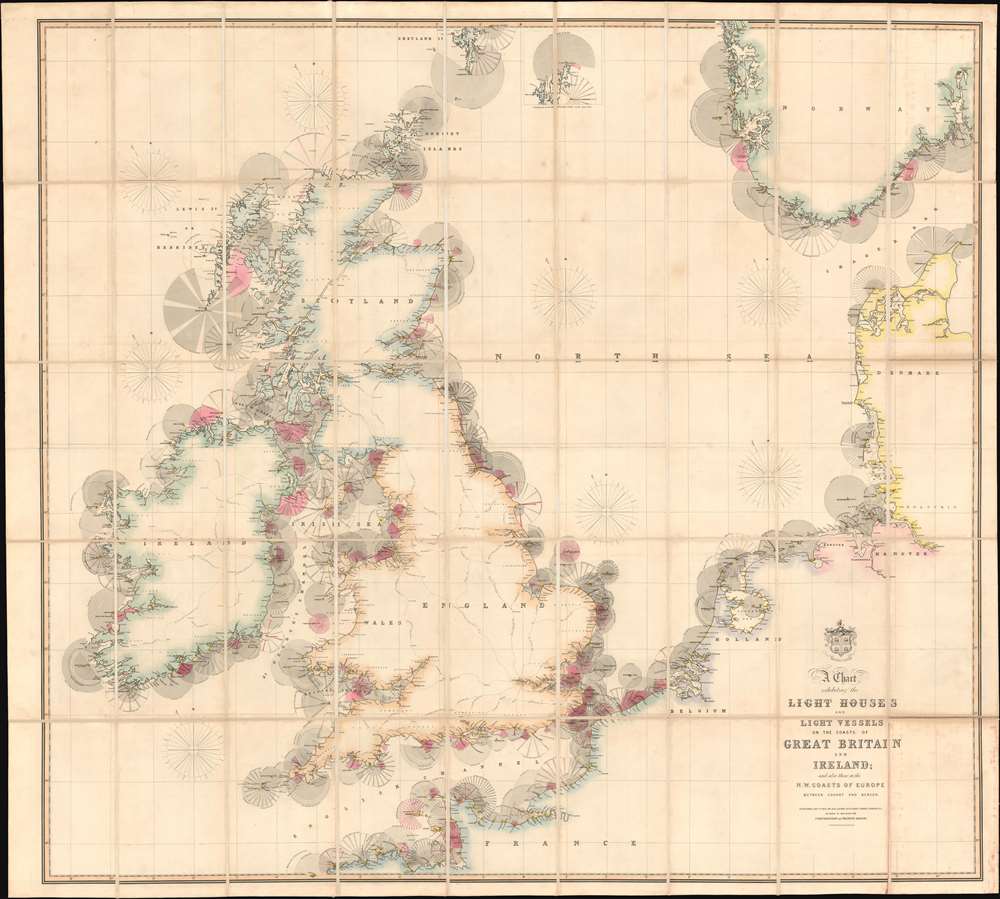
A Chart Exhibiting the Lighthouses and Light Vessels on the Coasts of Great Britain and Ireland and also those on the N.W. Coasts of Europe between Ushant and Bergen. Published by order of the Honble the Corporation of Trinity House, constructed by A. G Findlay.
sold
- Digital Map Information
- Suitable for large format printing
- Full resolution TIFF file
- ICC color profile embedded
- Delivered instantly via download link
An extraordinary 1863 chart and map exhibiting in great detail the lighthouses of Great Britain, including England, Ireland, Wales, and Scotland, and around the North Sea as far as Norway, Holland, France, and Denmark. The chart provides essential information for the mariner with regard to understanding and identifying the region's many lighthouses and what they communicate. In addition, the map illustrates the major regional railroads and their connections to major ports. The whole is impressively presented in a handsome presentation case with gilt stamped cover and brass closures. (more details)
Czech nationalism.
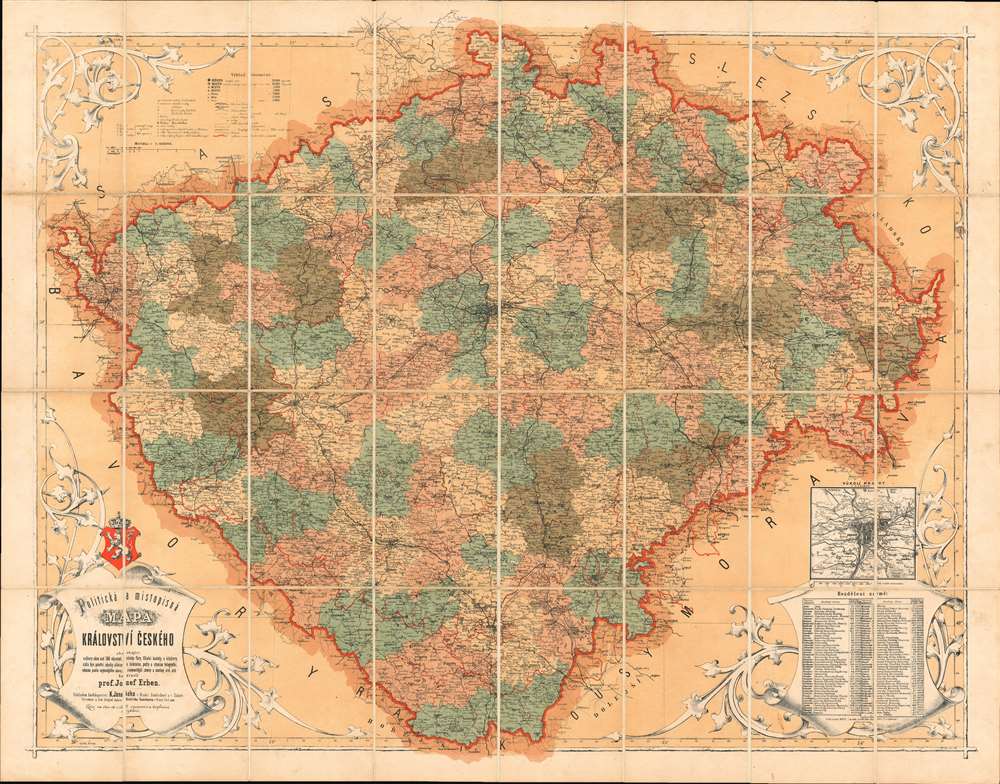
Politicka a Mistopisna Mapa Kralovstvi Ceskeho.
sold
- Digital Map Information
- Suitable for large format printing
- Full resolution TIFF file
- ICC color profile embedded
- Delivered instantly via download link
A rare and beautiful 1872 chromolithograph map of Bohemia (today's Czech Republic) by Czech publisher Josef Erben. This map is significant as, issued during a time of Czech cultural revival and growing nationalism, it represents one of the first maps of Bohemia issued fully in Czech. As such, it is one of the first maps to employ and promote Czech cartographic terminology, which lacking established native cartographic tradition, Erben had to invent from scratch. The terminology presented here had a significant influence on other Czech and subsequent Slavic cartography, who took inspiration from Erben's vocabulary. (more details)
French perspective map of the French and Indian War.
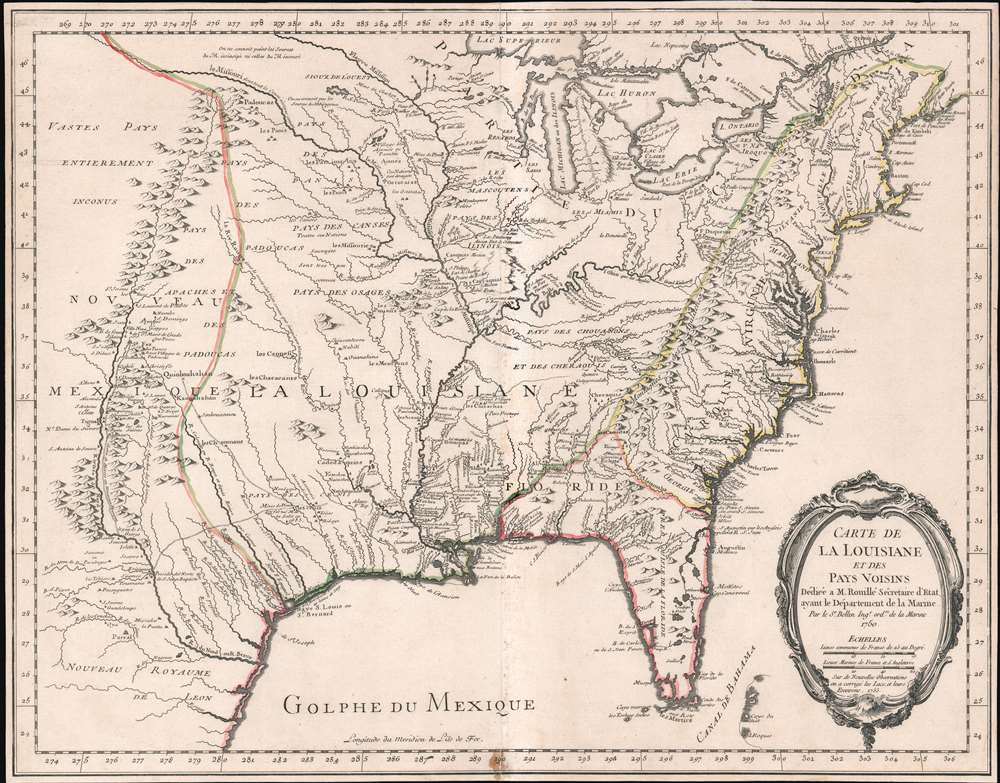
Carte de La Louisiane et des Pays Voisins.
sold
- Digital Map Information
- Suitable for large format printing
- Full resolution TIFF file
- ICC color profile embedded
- Delivered instantly via download link
An unusual and scarce 1755 map of North America by Jacques-Nicolas Bellin issued at the outbreak of the French and Indian War (1754 - 1763). Centered on the vast Mississippi Valley, the map covers from the Rio Grande to the Atlantic Seaboard and from Lake Superior to the Florida Keys. While first issued in 1750, the present map has been updated considerably to represent French, English, and Spanish claims at the outbreak of the French and Indian War. Most of the most important battle sites are forts are noted, including Fort Duquesne, Fort Necessity, Fr. Le Boeuf, Fort Presqu'Isle, and Fort St. Frederic, among others. (more details)
Full color 18th century double hemisphere map.

Mappa totius mundi Adornata juxta Observationes Dnn Academiae Regalis Scientiarum et nonnullorum aliorum, secundum annotationes recentissimas.
sold
- Digital Map Information
- Suitable for large format printing
- Full resolution TIFF file
- ICC color profile embedded
- Delivered instantly via download link
This is a stunning double hemisphere map of the world prepared by Guillaume De L'Isle and published by Tobias Conrad Lotter in 1775. The map consists of two central hemispheres, eastern and western, surrounded by smaller polar projections. Cartographically this map is altogether fascinating and exemplifies De L'Isle's careful scientific style of cartography. (more details)
Dramatic bird's-eye view of Shanghai.

上海 [上海] / Shanghai.
sold
- Digital Map Information
- Suitable for large format printing
- File Size: 14.19 MB
- File Type: ZIP / TIFF
- ICC color profile embedded
- Delivered instantly via download link
A rare 1939 Japanese view of Shanghai issued by view maker Tsunemitsu Kaneko and published in Japanese controlled Shanghai. This map was issued at the height of the Second Sino-Japanese War, after the Battle of Shanghai I (1937) but before the abandonment of the Concessions (1941). It exemplifies the political tensions in Shanghai at an epic moment of east-west confrontation. Broadway Mansions (百老汇大厦), the massive and distinctive art deco development in the Hongkou district stands out prominently. (more details)
An update to a map from a landmark atlas of New York.
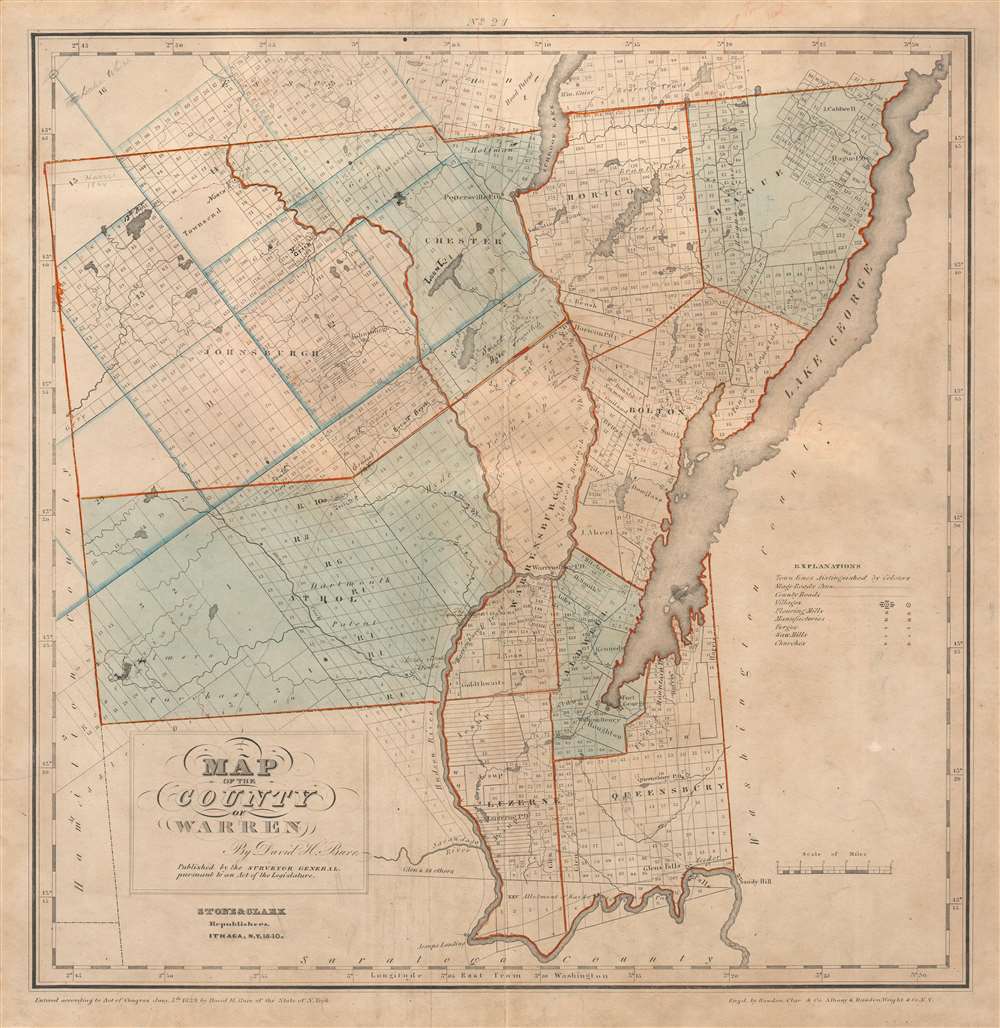
Map of the County of Warren.
sold
- Digital Map Information
- Suitable for large format printing
- Full resolution TIFF file
- ICC color profile embedded
- Delivered instantly via download link
This is an 1840 David Burr map of Warren County, New York. Depicting the region from Hamilton County to Lake George and Washington County and from Essex County to Saratoga County, individual townships are identified and shaded different colors to allow for easy differentiation. Numerous private land claims are illustrated, some of which are identified by name. Some locations are labeled in manuscript in ink. The county's lakes and rivers are illustrated and labeled, including Schroon Lake, Brant Lake, and, of course, Lake George. In one of Stone and Clark's updates to Burr's 1829 edition, the county's post offices marked 'P.O.' are labeled. (more details)
On the cusp of change.
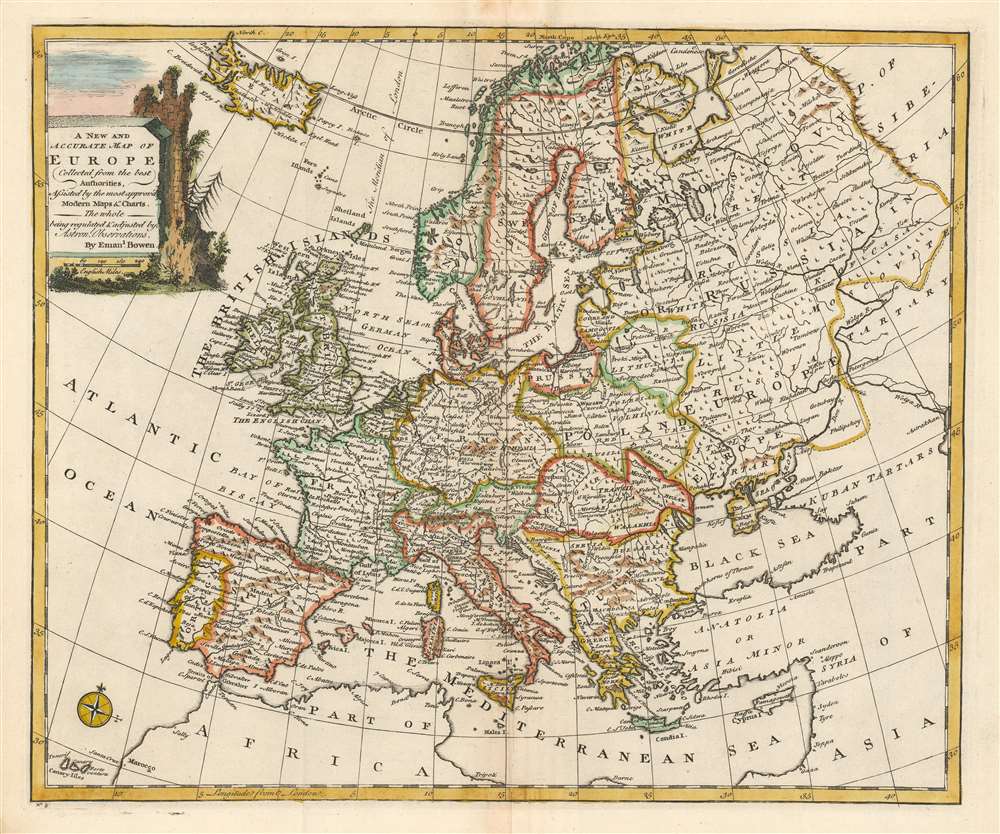
A New and Accurate Map of Europe.
sold
- Digital Map Information
- Suitable for large format printing
- Full resolution TIFF file
- ICC color profile embedded
- Delivered instantly via download link
This is a beautiful 1747 decorative map of Europe by the English cartographer Emmanuel Bowen. The map covers from Iceland to Tartary and south as far as North Africa. It also includes western Russia and the Black Sea. It renders the entire region in extraordinary detail offering both topographical and political information with forests and mountains beautifully rendered in profile. Territories and kingdoms are noted with outline color. (more details)
A wonderful broadside promoting tourism in Mexico City.

Mexico. The Great Metropolis.
sold
- Digital Map Information
- Suitable for large format printing
- File Size: 78.7 MB
- File Type: ZIP / TIFF
- ICC color profile embedded
- Delivered instantly via download link
This is a c. 1947 A. Regaert broadside map of Mexico City, promoting the Mexican capital as a tourist destination. The broadside focuses on an intersection in central Mexico City, the El Caballito Circle (Círculo El Caballito), the Avenue de la República, and the Avenue Paseo de la Reforma. The other statue occupying the traffic circle on the left is the Monument to Christopher Columbus (Monumento a Colón) on the Avenue Paseo de la Reforma, which was removed in 2020 after a protest was scheduled to tear it down. The arch on the Avenue de la Repūblica is the Monument to the Revolution (Monumento a la Revolución). This monument was initially meant to be the Federal Legislative Building and was commissioned by Porfirio Díaz, but its construction was interrupted by the Mexican Revolutionary War. After the civil war ended, Mexican architect Obregón Santacilia proposed converting it into a monument to the heroes of the Revolution. Completed in 1938, today it is recognized as the tallest triumphal arch in the world and stands 220 feet high. (more details)