
Celebrates the end of World War II in both Europe and the Pacific - includes photos of the flag raising on Iwo Jima and the atomic bomb.
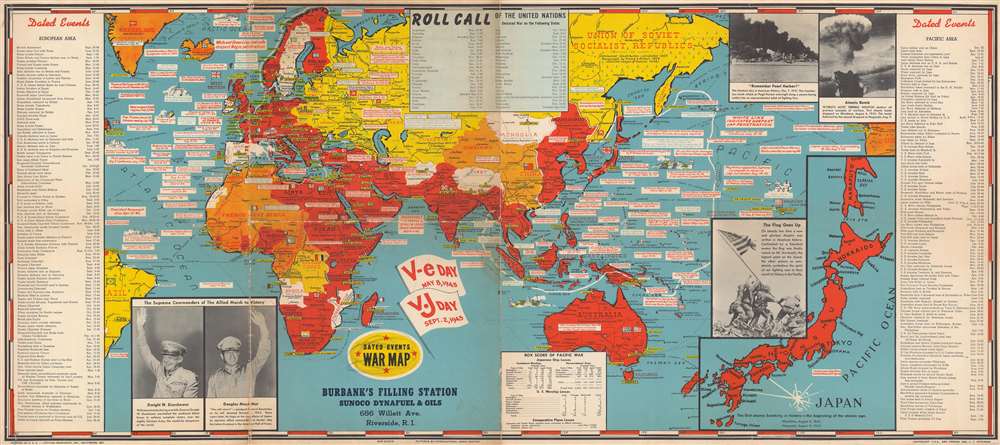
Dated Events War Map.
sold
- Digital Map Information
- Suitable for large format printing
- File Size: 44.12 MB
- File Type: ZIP / TIFF
- ICC color profile embedded
- Delivered instantly via download link
This is a 1945 Stanley Francis Turner map of the world at the end of World War II. The map depicts the world from St. John's in Newfoundland, Canada to Salt Lake City, Utah and from the Barents Sea and the Arctic Ocean to Macquarie Island in the southwest Pacific Ocean. Myriad events throughout the European, North African, and Pacific Theaters of War are identified, including numerous declarations of war, the Japanese attack on Pearl Harbor, the D-Day Invasion of France, the liberation of Rome and Paris, and nearly all the amphibious landings in the Pacific island-hopping campaign. Rommel's retreat from Egypt through Libya into Tunisia is noted by a white line, while solid white lines in Europe, Africa, and the Pacific illustrate the greatest extent of Axis gains.
Two large flags, just below center, commemorate and celebrate V-E (Victory in Europe) Day, May 8, 1945, and V-J (Victory over Japan) Day, September 2, 1945. Events in the European Theater are chronicled along the map's left border, from the Munich Agreement on September 30, 1938 to Clement Attlee's inauguration as Prime Minister, replacing Winston Churchill. Events during the Pacific War are listed along the right border, from the beginning of the Shanghai Incident between China and Japan in January 1932 to V-J Day. A 'box score of the Pacific War', situated along the bottom border, lists the number of ships lost by both the Japanese and the U.S. during the course of the war, along with the comparative losses of the number of airplanes. A large inset map of Japan is located in the lower right corner, while photographs of the Pearl Harbor attack and one of the mushroom clouds from the atomic bombs dropped on Japan occupy the upper right corner. Photographs of General Eisenhower and General MacArthur are included in the lower left corner. (more details)
Two large flags, just below center, commemorate and celebrate V-E (Victory in Europe) Day, May 8, 1945, and V-J (Victory over Japan) Day, September 2, 1945. Events in the European Theater are chronicled along the map's left border, from the Munich Agreement on September 30, 1938 to Clement Attlee's inauguration as Prime Minister, replacing Winston Churchill. Events during the Pacific War are listed along the right border, from the beginning of the Shanghai Incident between China and Japan in January 1932 to V-J Day. A 'box score of the Pacific War', situated along the bottom border, lists the number of ships lost by both the Japanese and the U.S. during the course of the war, along with the comparative losses of the number of airplanes. A large inset map of Japan is located in the lower right corner, while photographs of the Pearl Harbor attack and one of the mushroom clouds from the atomic bombs dropped on Japan occupy the upper right corner. Photographs of General Eisenhower and General MacArthur are included in the lower left corner. (more details)
An 18th century French map of South Africa that labels Dutch colonies.
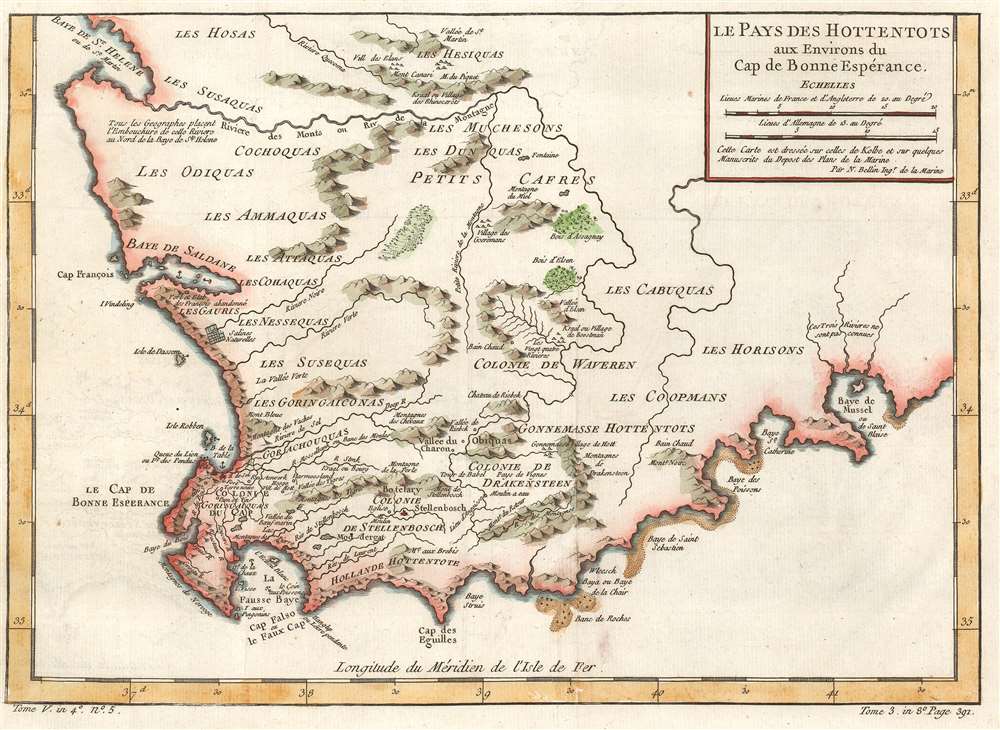
Le Pays des Hottentots aux Environs du Cap de Bonnes Espérance.
sold
- Digital Map Information
- Suitable for large format printing
- DPI: 600
- File Size: 7.74 MB
- File Type: ZIP / TIFF
- ICC color profile embedded
- Delivered instantly via download link
This is a 1754 Jacques-Nicolas Bellin map of western South Africa. The map depicts the region from the Atlantic Ocean to Mossel Bay and from St. Helena Bay to Cape Agulhas. Several Dutch colonies are labeled near the coast, including Cape Colony, Stellenbosch Colony and Drakensteen Colony. Both Stellenbosch and Drakenstein are modern municipalities outside of Cape Town. In this region, rivers and mountains are labeled, as are settlements, and even a church near Stellenbosch. Outside these three colonies, areas are labeled by the tribe that lived there. These names, however, are not what the tribes called themselves. The words 'cafre' and 'hottentot' are both used here. Today, these words are recognized as deeply insulting and offensive racial slurs. In the 17th and 18th centuries the term 'Hottentots', today known as the Khoikhoi, were characterized by savagery and were often depicted as cannibals. (more details)
Illustrates the still-to-be-completed Jacksonville, Pensacola, and Mobile Railroad.
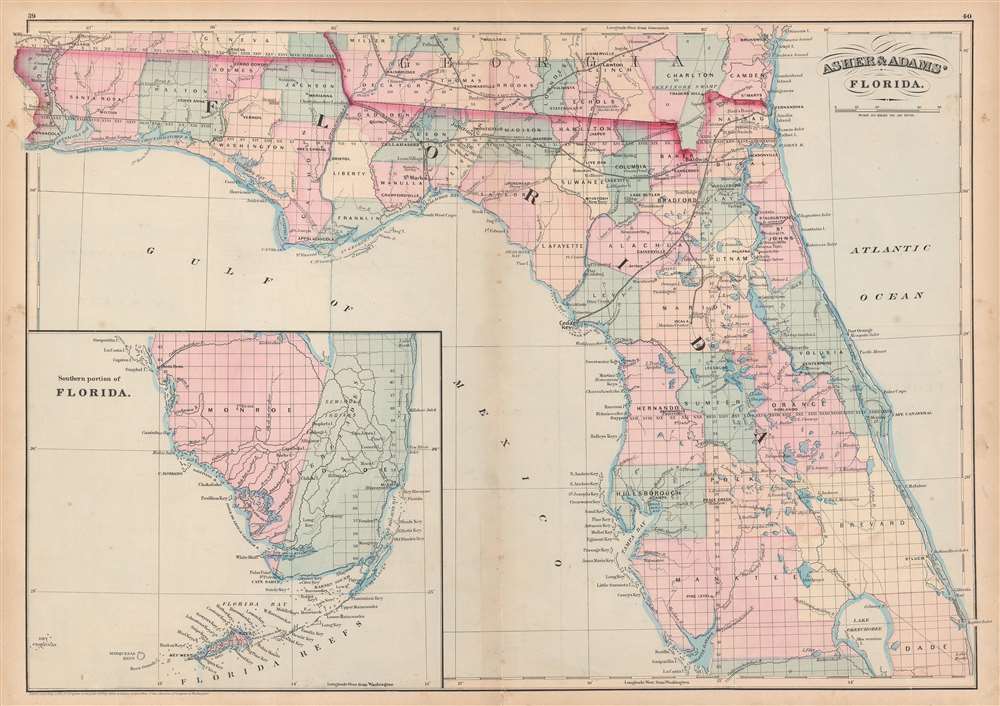
Asher and Adams' Florida.
sold
- Digital Map Information
- Suitable for large format printing
- File Size: 19.59 MB
- File Type: ZIP / TIFF
- ICC color profile embedded
- Delivered instantly via download link
This is an 1872 Asher and Adams map of Florida. The map depicts the state from the Perdido River to the Atlantic Ocean and from Georgia and Alabama to Lake Okeechobee and Charlotte Harbor. An inset map situated in the Gulf of Mexico illustrates southern Florida ... (more details)
The routes of Captains Cook and Wilkes are depicted and the site of Cook's death is noted.
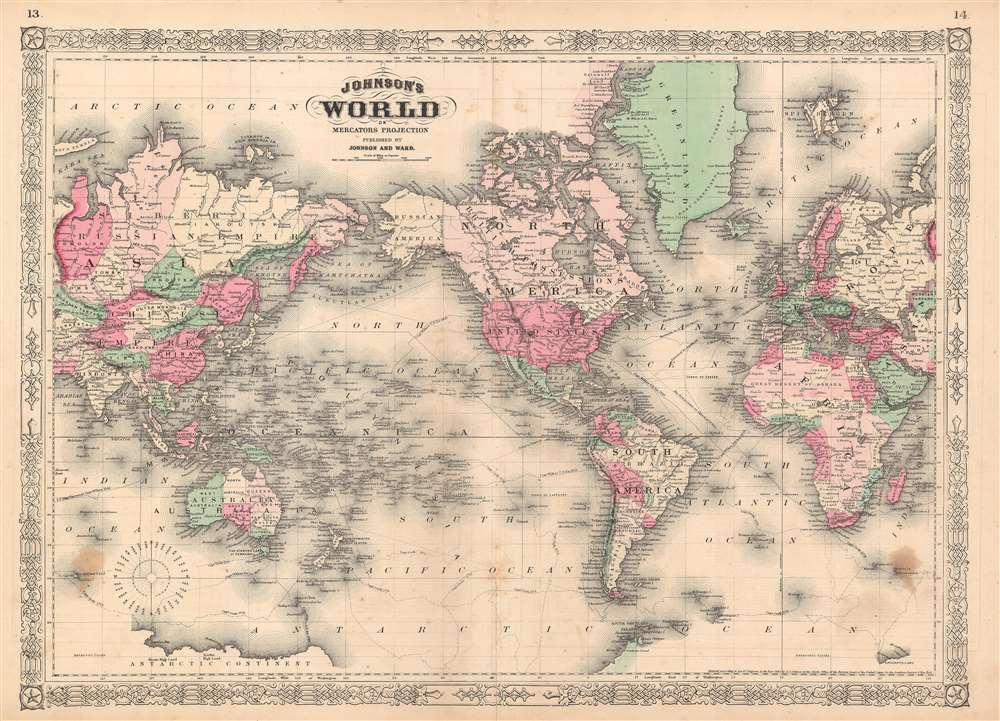
Johnson's World on Mercator's Projection.
sold
- Digital Map Information
- Suitable for large format printing
- File Size: 35.35 MB
- File Type: ZIP / TIFF
- ICC color profile embedded
- Delivered instantly via download link
This is an 1865 A. J. Johnson map of the world on Mercator's Projection. The map depicts the entire world centered on North and South America. This edition was updated from earlier versions to reflect recent discoveries in Africa, including Lake Victoria's ... (more details)
A scarce edition of Johnson's world map in hemispheres.

Johnson's Western Hemisphere. Johnson's Eastern Hemisphere.
sold
- Digital Map Information
- Suitable for large format printing
- File Size: 33.88 MB
- File Type: ZIP / TIFF
- ICC color profile embedded
- Delivered instantly via download link
This is an 1863 A. J. Johnson and Benjamin P. Ward map of the world on a hemispherical projection. Offering a look at the world during a period of rapid globalization, the map depicts the world in two hemispheres, with the hemispheres meeting in the ... (more details)
Issued during the American Civil War for Spanish Blockade Runners!
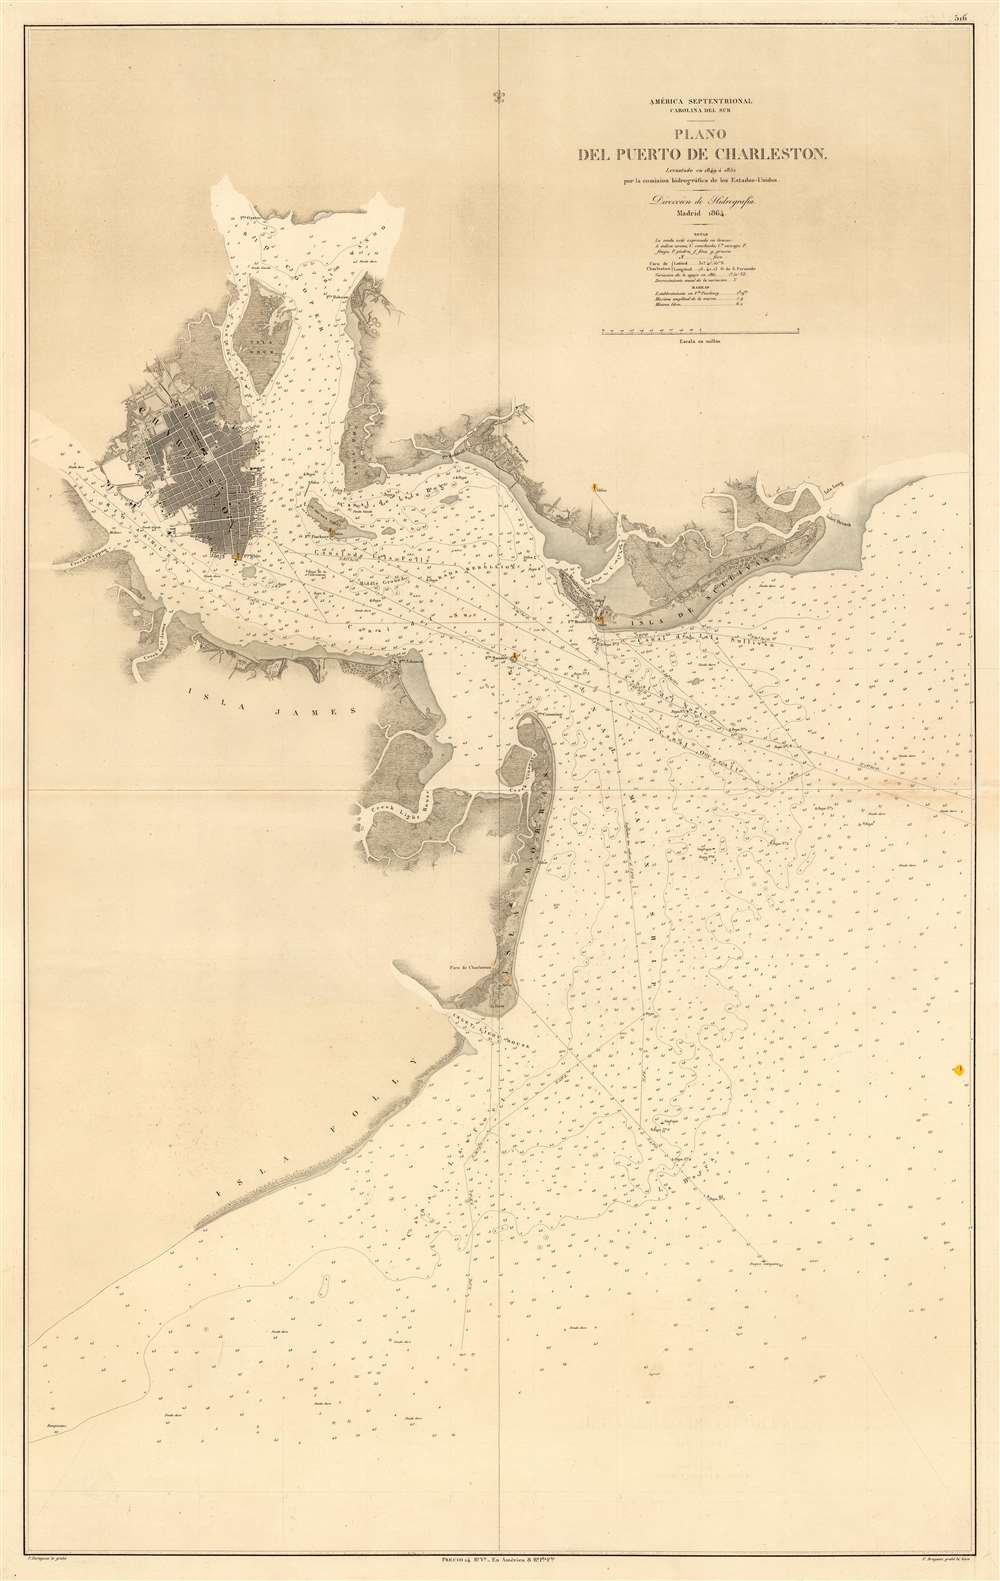
América Septentrional Carolina del Sur. Plano del Puerto de Charleston.
sold
- Digital Map Information
- Suitable for large format printing
- File Size: 38.38 MB
- File Type: ZIP / TIFF
- ICC color profile embedded
- Delivered instantly via download link
An utterly stunning 1864 Civil War Era Spanish Direccion de Hidrografia nautical chart or maritime map of Charleston Harbor, South Carolina. Probably issued for use by Spanish blockade runners during the American Civil War. The map covers the South Carolina coast from Sullivan Island to Folly Island, with a focus on Charleston Harbor. Charleston itself is beautiful engraved and situated between the Ashley and Cooper Rivers. The street grid is detailed, including piers, parks, individual buildings, and more. Similar attention has been given to the Charleston Harbor town of Mount Pleasant and Moultrieville, both of which have since been folded into greater Charleston. (more details)
Rare and striking city plan of Madrid.
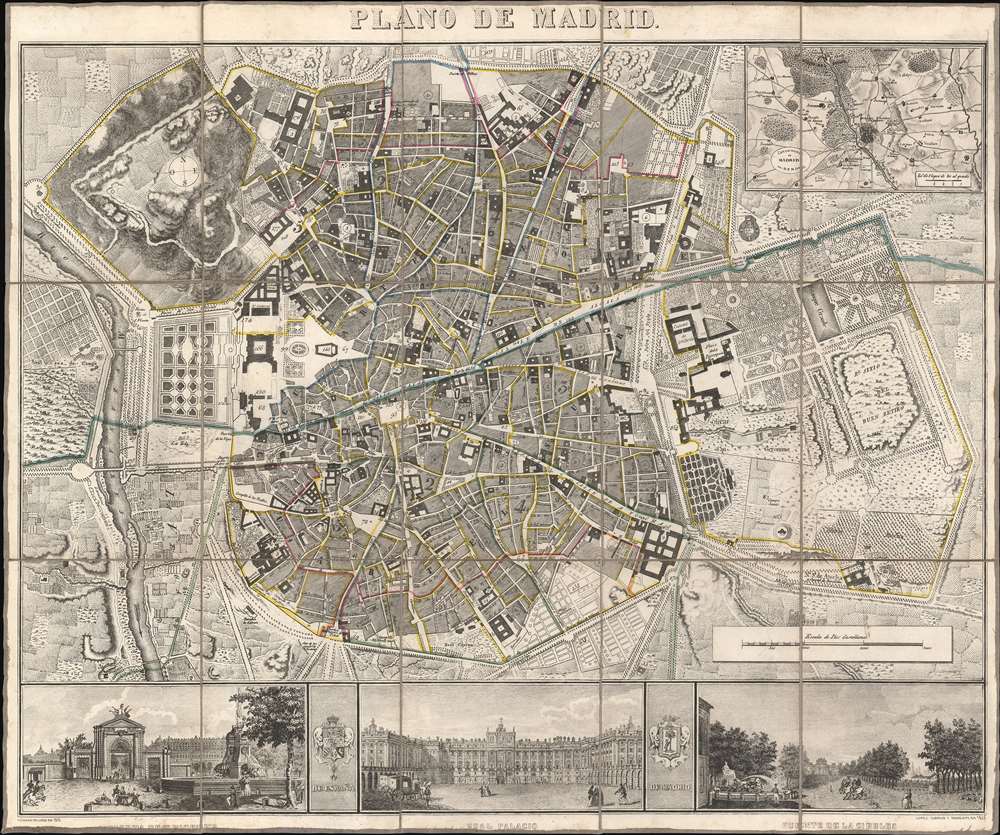
Plano de Madrid.
sold
- Digital Map Information
- Suitable for large format printing
- DPI: 600
- File Size: 44.25 MB
- File Type: ZIP / TIFF
- ICC color profile embedded
- Delivered instantly via download link
This is a beautiful 1846 Pedro Martín de López city map or plan of Madrid, Spain. The map depicts the city from the Manzanares River to Retiro Park (Parque del Buen Retiro) and from the Puerta de Bilbao to the Puerta de Toledo. Presented in exceptional detail and fine engraving, over 180 different locations are numerically identified numerically. Streets throughout the city are labeled, including the Calle Mayor. An inset of Madrid and its environs is situated in the upper right corner. Three views, illustrating the Fuente de la Cibeles, the Real Palacio, and the Puerta de San Vicente are included along the bottom border and separated by the Coat of Arms of Spain and Madrid. (more details)
Two U.S. Air Force aeronautical charts joined to form one gigantic chart of Southeast Asia during the Vietnam War.
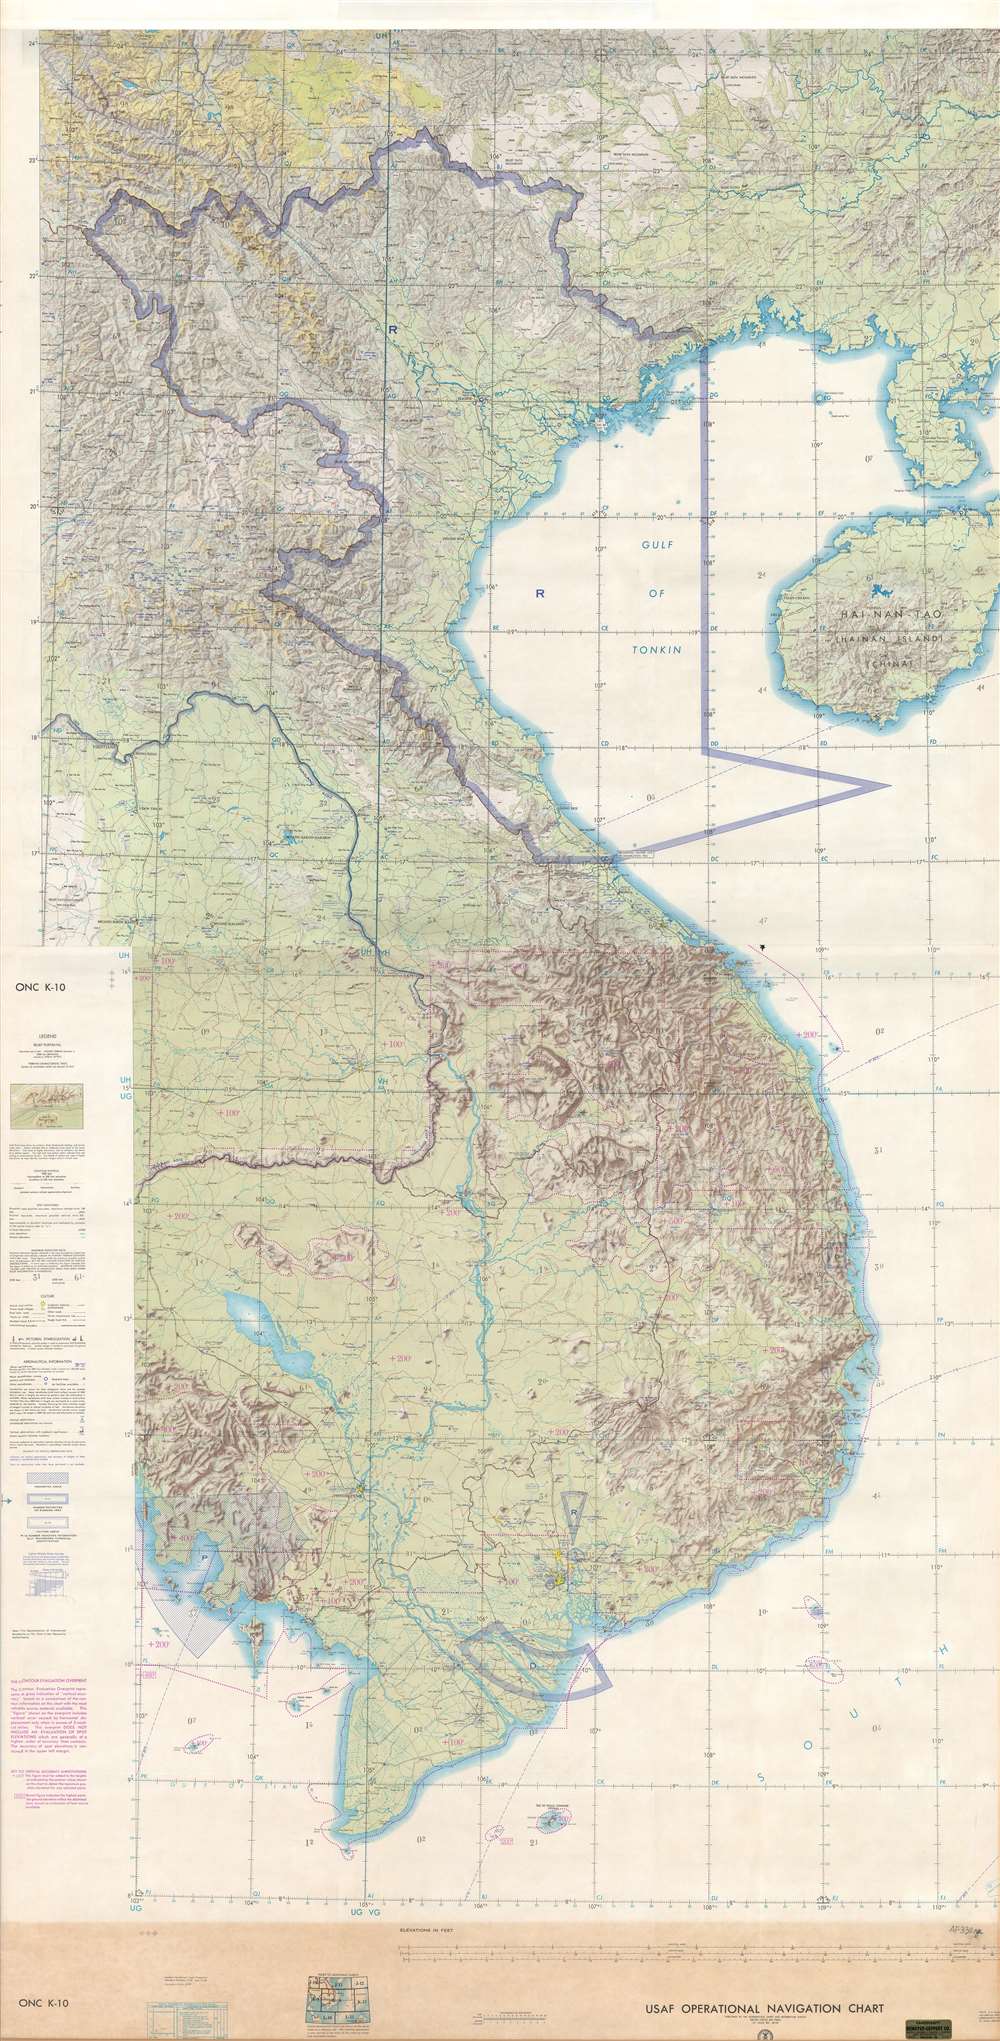
USAF Operations Navigation Chart ONC K-10 / USAF Operations Navigation Chart ONC J-11.
sold
- Digital Map Information
- Suitable for large format printing
- Full resolution TIFF file
- ICC color profile embedded
- Delivered instantly via download link
This is a c. 1970 United States Air Force aeronautical chart of Southeast Asia. The map, which is two charts joined together and mounted on linen, depicts the region from the meridian 102° east of Greenwich to the Leizhou Peninsula and Hainan and ... (more details)
Rare working nautical chart of the Canadian Maritimes.
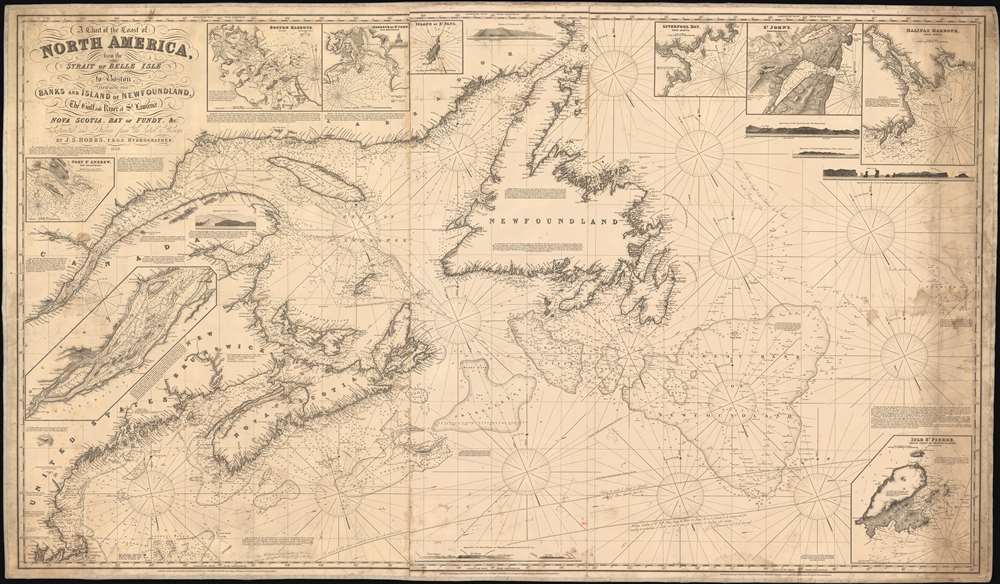
A Chart of the Coast of North America, from the Strait of Belle Isle to Boston including the Banks and Island of Newfoundland, The Gulf and River of St. Lawrence, Nova Scotia, Bay of Fundy, and c.
sold
- Digital Map Information
- Suitable for large format printing
- Full resolution TIFF file
- ICC color profile embedded
- Delivered instantly via download link
A scarce 1848 John Stratton Hobbs British blueback nautical chart or maritime map of the Canadian Maritime Provinces and the Gulf of St. Lawrence. The map covers from Labrador to Boston, including Newfoundland, Nova Scotia, Anticosti Island, and New Brunswick, as far as Cape Cod, including the entire New England coastline from Connecticut to Maine. Inset maps detail Halifax Harbor, Boston Harbor, St. John, the Island of St. Paul, Port St. Andrew, Liverpool Bay, St. Johns, and the Island of St. Pierre. Exhibit copious soundings and annotations of practical use to the mariner. (more details)
Rare signed edition of Smith's pictorial map of Virginia.
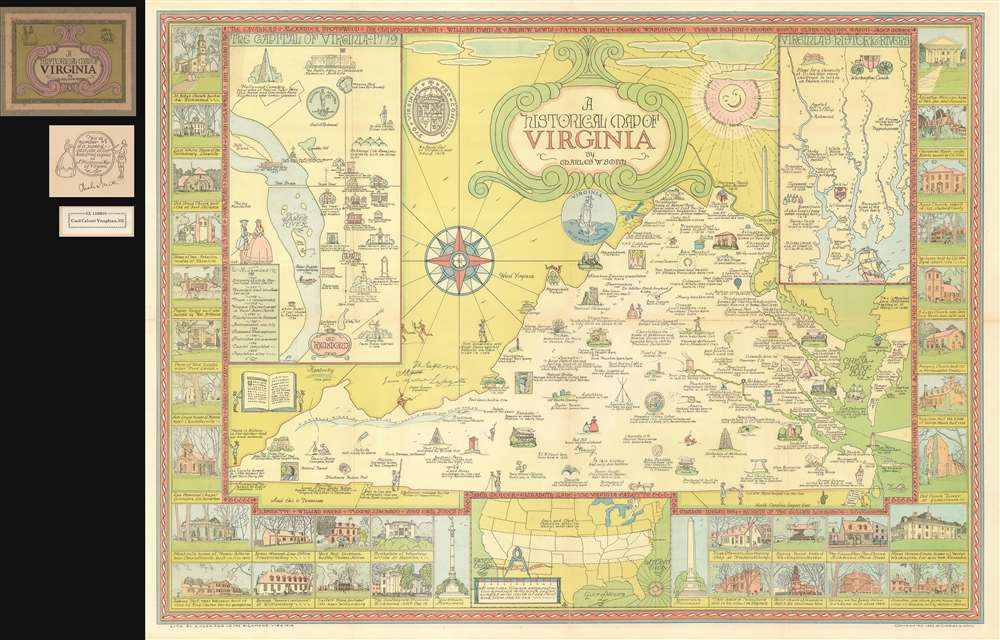
A Historical Map of Virginia.
sold
- Digital Map Information
- Suitable for large format printing
- File Size: 74.91 MB
- File Type: ZIP / TIFF
- ICC color profile embedded
- Delivered instantly via download link
A rare 1930 historical and pictorial map of Virginia by Charles William Smith. The map is essentially an outline of the state's borders with numerous pictorial vignettes illustrating historic events, important buildings, and other locations. The main map is supplemented by smaller maps illustrating 'historic rivers,' 'Old Richmond,' and the coast to coast boundaries of Virginia's original charter. In addition, there are numerous smaller illustrations of historic buildings throughout the state. A message circling the sun reads 'The Sunshine nowhere shines so bright as in Virginia.' (more details)
An ethnographic pictorial wall map of Africa.
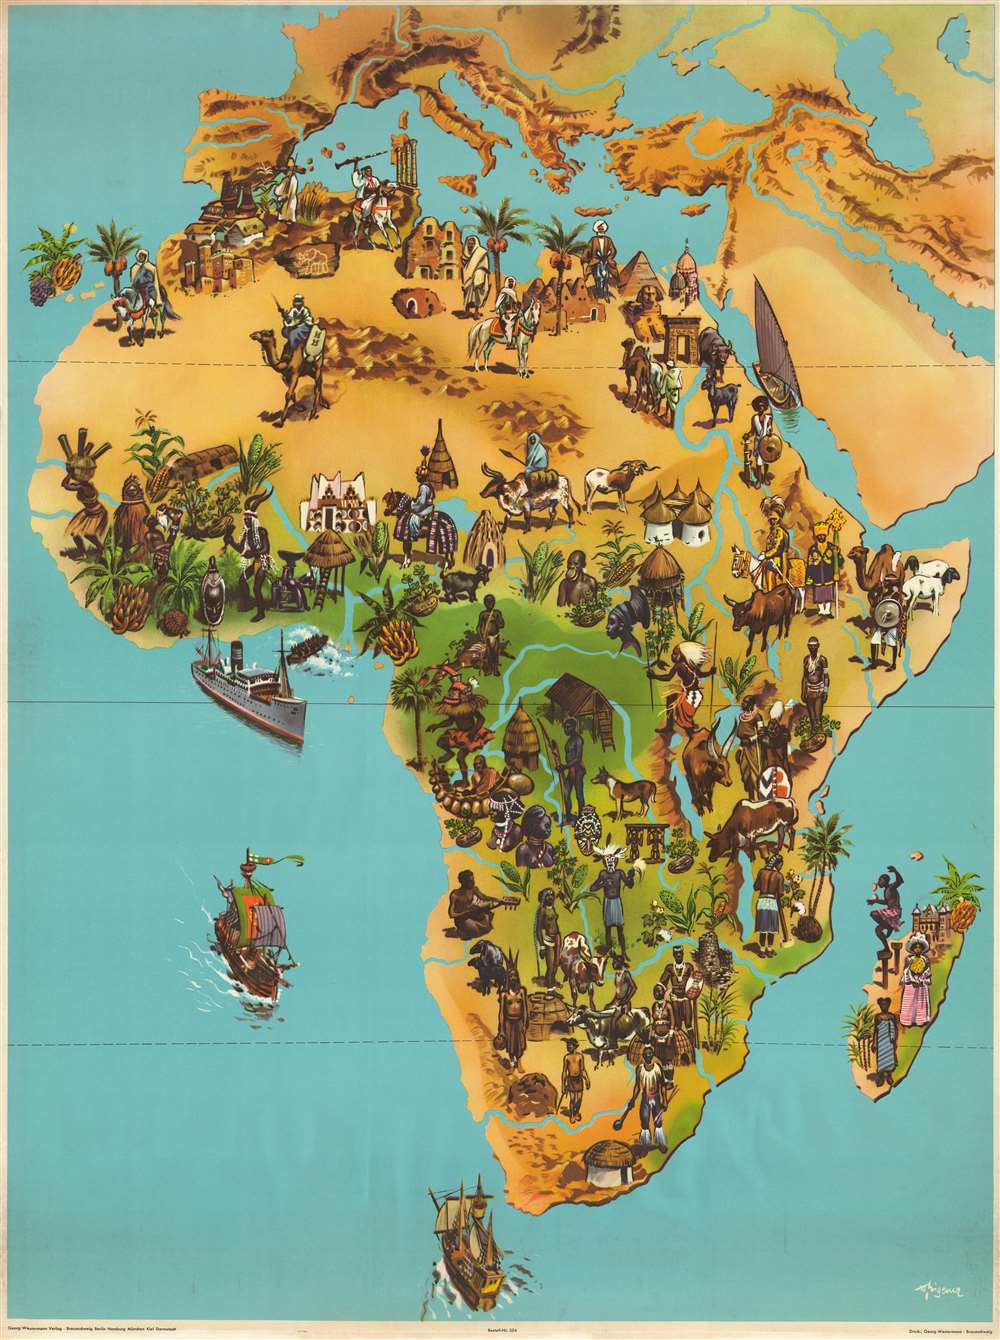
[Africa].
sold
- Digital Map Information
- Suitable for large format printing
- File Size: 124.47 MB
- File Type: ZIP / TIFF
- ICC color profile embedded
- Delivered instantly via download link
This is a c. 1957 Georg Westermann Verlag pictorial wall map of Africa. The map depicts the entire continent, stretching from central Europe to the Cape of Good Hope and from the Atlantic Ocean to the Indian Ocean and the Persian Gulf. Stunningly ... (more details)
Map of Mount Desert Island and the Coast of Maine, home of the Acadia National Park.
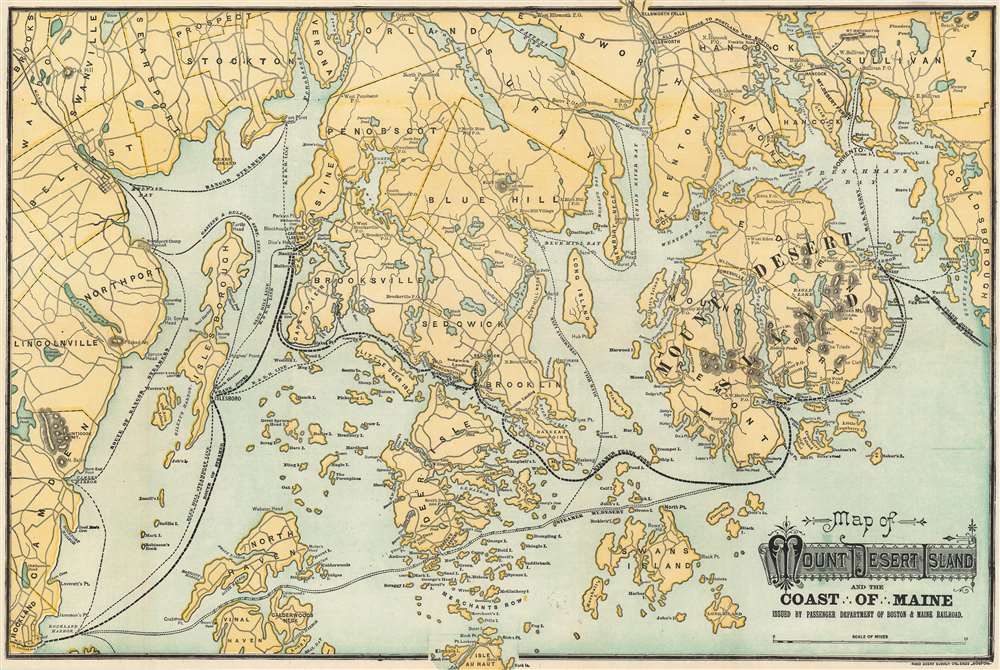
Map of Mount Desert Island and the Coast of Maine.
sold
- Digital Map Information
- Suitable for large format printing
- File Size: 25.79 MB
- File Type: ZIP / TIFF
- ICC color profile embedded
- Delivered instantly via download link
This is an attractive 1902 Rand Avery map of Mount Desert Island and the coast of Maine issued by the Passenger Department of Boston and Maine Railroad. The map depicts Mount Desert Island and vicinity from Lincolnville and Rockland east to Winter Harbor and north as far as Pattens Pond and Verona. Roads and towns are illustrated throughout, and steamship and ferry routes running between several islands are identified, including those of Blue Hill Steamship Co., the Maine Central Railroad ferry, and the Bangor steamers. The railway route to Portland and Boston is also noted. (more details)
One of the earliest maps to depict Florida with more than two counties.

Geographical, Statistical, and Historical Map of Florida.
sold
- Digital Map Information
- Suitable for large format printing
- DPI: 600
- File Size: 20.08 MB
- File Type: ZIP / TIFF
- ICC color profile embedded
- Delivered instantly via download link
This is a rare 1827 Henry Charles Carey and Isaac Lea map of Florida and is one of the first maps to show more than two counties in the state. The map depicts the region from the Perdido River to the Atlantic Ocean and from Alabama and Georgia to the Florida Keys. Highly detailed, numerous locations are labeled throughout the map, including St. Augustine, Tallahassee, and Pensacola. Counties are shaded different colors to allow for easy differentiation. Roads, rivers, and lakes are also labeled. (more details)
A map of Florida created using cerography, an early method of color printing using wax.
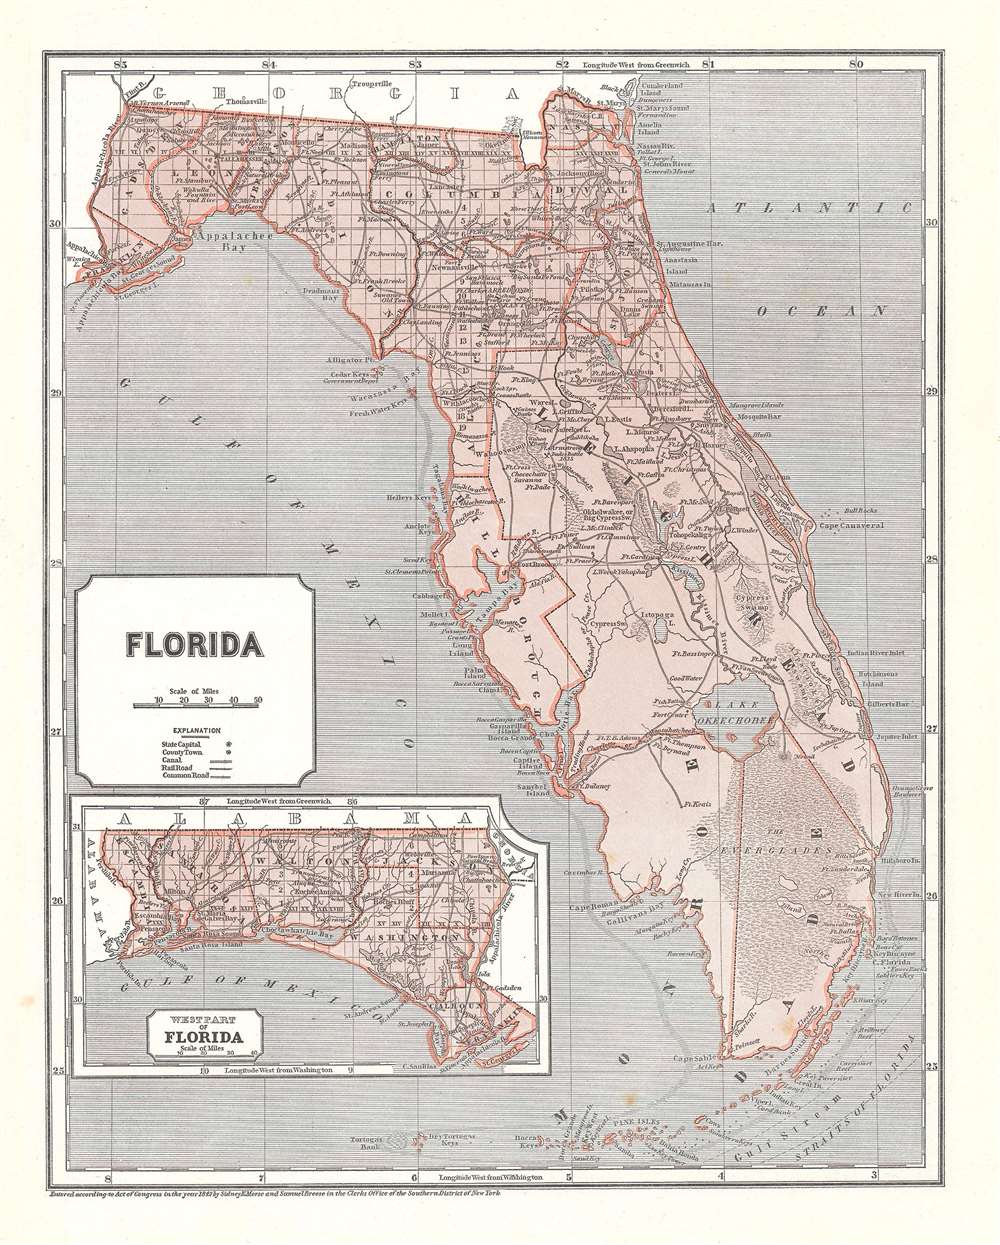
Florida.
sold
- Digital Map Information
- Suitable for large format printing
- DPI: 600
- File Size: 15.53 MB
- File Type: ZIP / TIFF
- ICC color profile embedded
- Delivered instantly via download link
This is an 1845 Sidney Edwards Morse and Samuel Breese map of Florida. The map depicts the state from the Apalachicola (Appalachicola) River to the Atlantic Ocean and from Georgia to the Straits of Florida and the Florida Keys. Wonderfully ... (more details)
A wonderful coast survey chart of the Chesapeake and Delaware Bays.

Sketch C Showing the Progress of the Survey in Section III From 1843 to 1852.
sold
- Digital Map Information
- Suitable for large format printing
- DPI: 600
- File Size: 39.82 MB
- File Type: ZIP / TIFF
- ICC color profile embedded
- Delivered instantly via download link
This is an 1852 U.S. Coast Survey nautical chart or maritime map of the Chesapeake Bay. The map depicts Bay from Susquehanna, Maryland to the northern Outer Banks in North Carolina and from Richmond and Petersburg, Virginia to the Atlantic Ocean. Extensive triangulation surveys were conducted the length of Chesapeake Bay and are illustrated here The Rappahannock, Potomac, and York Rivers are labeled, as is Hampton Roads. This is progress chart, so several more specific charts of the region are referenced here, allowing a viewer to locate a chart for the specific part of Chesapeake Bay they are looking for. (more details)
Depicts Mayon, the most famous and active volcano in the Philippines.
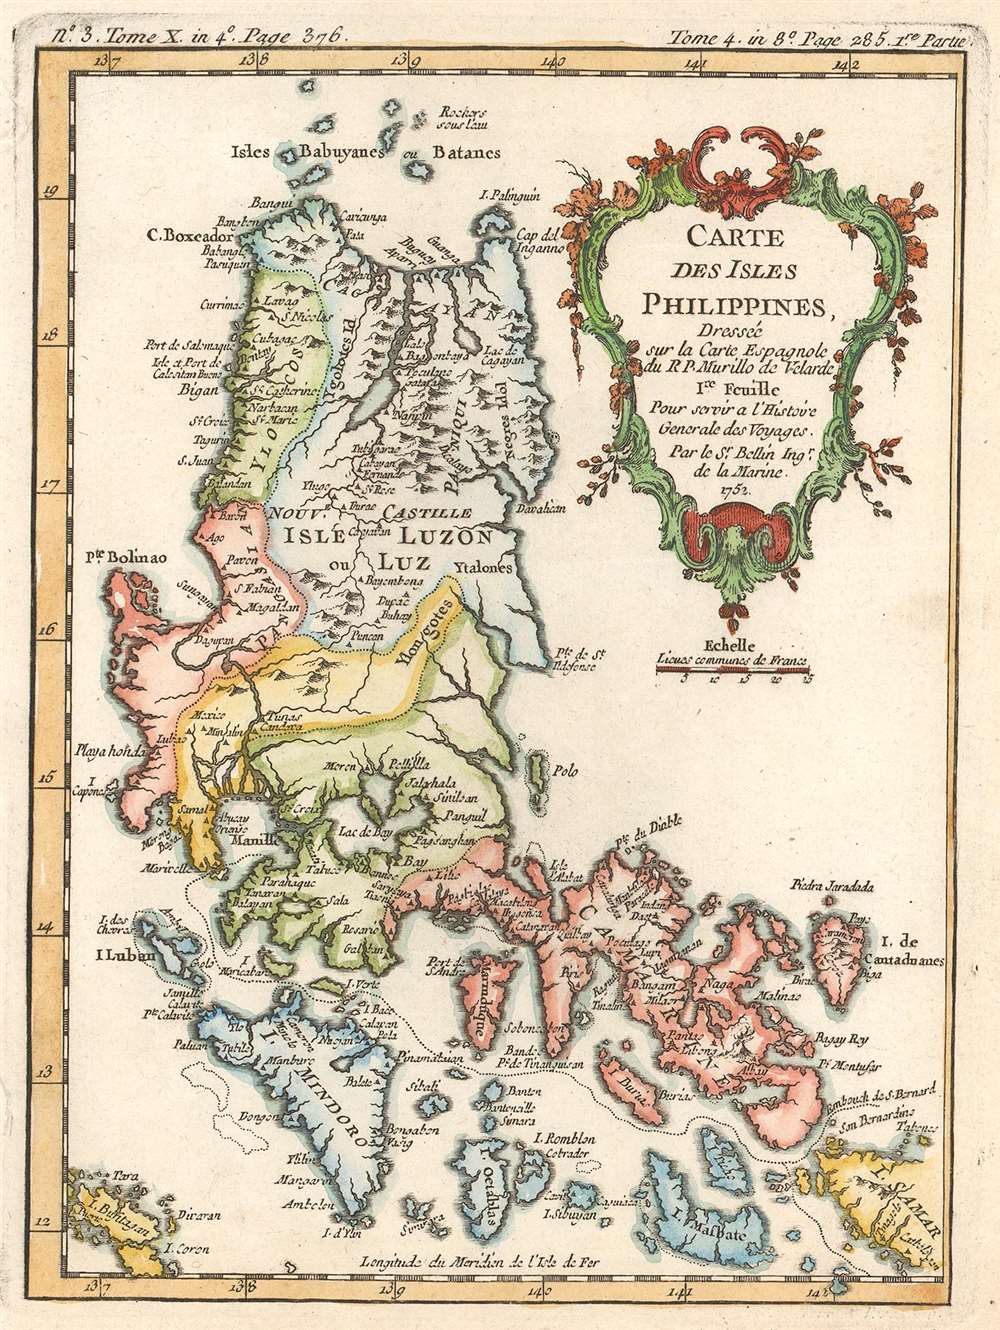
Carte des Isles Philippines. Dressée sur la Carte Espagnole du R.P. Murillo de Velarde. 1re Feuille. Pour servir a l'Histoire Générale des Voyages.
sold
- Digital Map Information
- Suitable for large format printing
- DPI: 600
- File Size: 3.4 MB
- File Type: ZIP / TIFF
- ICC color profile embedded
- Delivered instantly via download link
This is a 1752 Jacques-Nicolas Bellin map of the northern Philippines. The map depicts the region from Bolinao on Luzon to the islands of Samar and from the Babuyan Islands to Masbate Island and Coron Island. Beautifully engraved, myriad ... (more details)
A beautifully engraved 18th century map of the Arabian Peninsula - labels both Mecca and Medina.
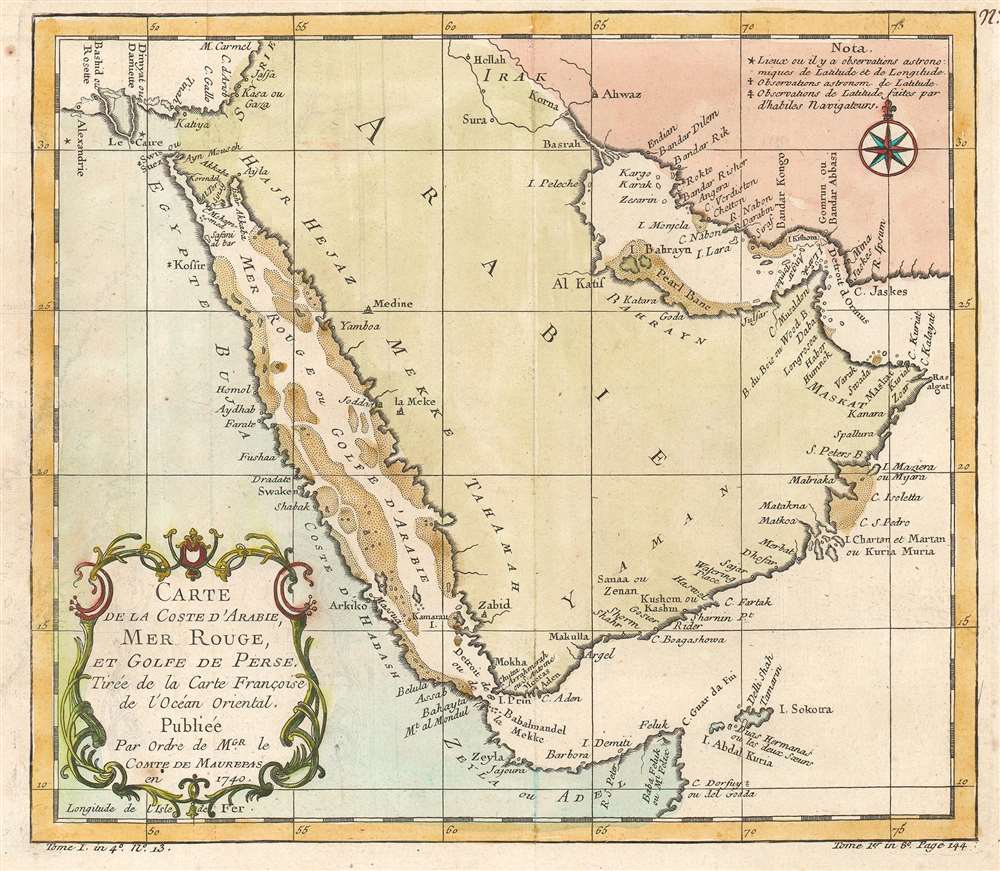
Carte de la Coste d'Arabie, Mer Rouge, et Golfe de Perse. Tirée de la Carte Françoise de l'Océan Oriental.
sold
- Digital Map Information
- Suitable for large format printing
- DPI: 600
- File Size: 5.29 MB
- File Type: ZIP / TIFF
- ICC color profile embedded
- Delivered instantly via download link
This is a 1740 Jacques-Nicolas Bellin Bellin map of the Arabian Peninsula. The map depicts the region from Alexandria, Egypt to the Gulf of Oman and from the Mediterranean Sea and Iraq to the Horn of Africa. Beautifully engraved, ... (more details)
A beautifully engraved map of Tahiti created from Captain Cook's surveys during his first voyage to the island.
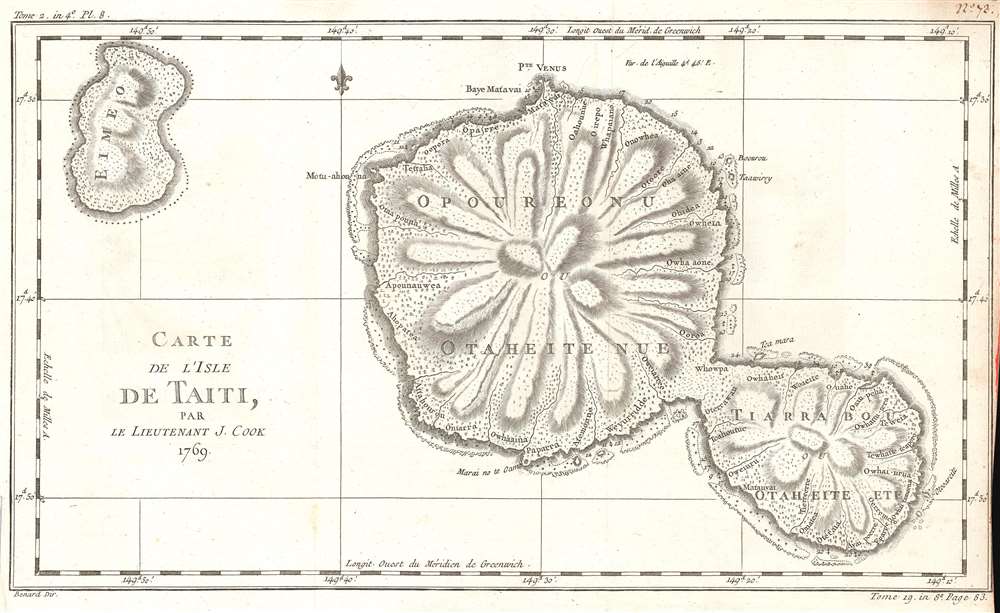
Carte de l'Isle de Taiti, Par le Lieutenant J. Cook.
sold
- Digital Map Information
- Suitable for large format printing
- DPI: 600
- File Size: 7 MB
- File Type: ZIP / TIFF
- ICC color profile embedded
- Delivered instantly via download link
This is a 1769 Jacques-Nicolas Bellin map of Tahiti in French Polynesia. The map depicts both Tahiti and Mo'orea. Created by Bellin from James Cook's charts of the island from his first voyage, numerous locations are identified. ... (more details)
The largest missionary map we have seen!
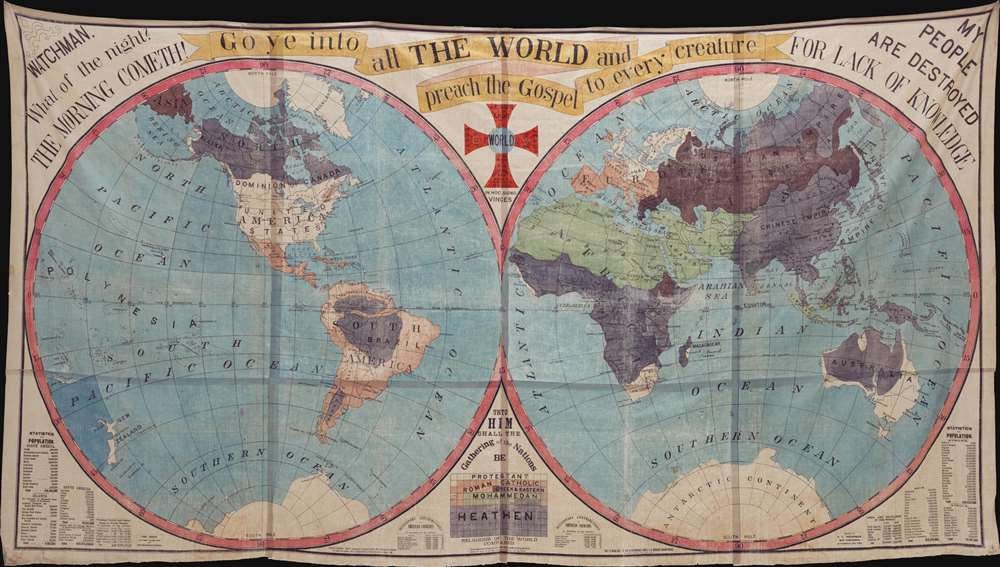
Go ye into all The World and preach the Gospel to every creature…
sold
The largest missionary map we have seen, this staggeringly massive production was published in 1905 by Truman D. Collins and known euphemistically as the 'Collins Map.' Printed on waxed linen cloth, several sheets of which have been stitched together to form a whole, the map presents the world in two large hemispheres. Color coding divides the world on religious grounds, illustrating the lands of various faiths, including Protestants, Roman Catholics, Greek and Eastern [Churches], Jews, Mohammedans, and Heathens. In addition, there are religious slogans, Biblical quotes, and statistical charts. The map was intended for 'big-tent' evangelical meetings where it would be used as a didactic tool to promote conversion and explain missionary ideology. (more details)
The Apocalypse in 1843?

A Chronological Chart of the Visions of Daniel and John.
sold
- Digital Map Information
- Suitable for large format printing
- Full resolution TIFF file
- ICC color profile embedded
- Delivered instantly via download link
Known as the '1843 Chart', this rare Millerite chronological chart predicts the end-of-days in 1843. Printed on cloth by Benjamin Thayer, this chart is a didactic tool illustrating the predictions of William Miller. The chronology records world history from roughly 700 BC to 1843, when Miller, based upon Biblical calculus and prophetic interpretation, predicted Christ would come again heralding Armageddon. The allegorical 'beasts' of Armageddon are illustrated, among them various goats, a 7 headed dragon, a lion-bull creature, and more. The chart was published by Joshua Vaughan Himes, who served as Miller's publicist and pamphleteer after 1840. he publicaion of htis chart was significant as it was meant both to fulfill prophecy and for use at 'big tent' evangelical gatherings. (more details)